A.re you a good driver? Research indicates that greater than 90 percent of us would answer “Yes.” And yet, the truth is that a lot fewer of us are as good at driving as we think we are. We can ask the same question about our businesses: Are you a good practice owner and are there good business processes in your practice? My guess is that most equine practitioners would say, “Yes; we have a nice practice and do fairly well.”
But how does your practice compare to those of your peers? Most practitioners don’t know. Comparisons made over drinks at meetings may help you feel as though you’re on the right track, but they don’t help you increase your revenue, improve patient service or retain clients in a quantifiable way. As individual veterinarians, our practices are as unique as the veterinarians running them. We may convince ourselves that our knowledge, skill levels, experience and business acumen are better than those of anyone else in the marketplace, but how do we really know?
This is where the concept of benchmarking comes into play. Benchmarking allows us to compare our practices to others in a real and meaningful way. It is useful when data is collected and reported uniformly (comparing apples to apples, as the saying goes). There are different types of benchmarking and it’s something that can positively influence a practice.
Benchmarking is the process of comparing one’s business processes and performance activities to those same performance metrics among the industry’s best. The dimensions typically measured are quality, time and cost. In the benchmarking process, one compares best practices in one’s industry, or in a similar industry, with one’s own results and processes. In this way, we as veterinarians can learn how well our businesses are performing and why our practices may or may not be successful.
The Value of Benchmarking
Managers use benchmarking to compare various aspects of their processes to best-practice companies’ processes, usually within a peer group. The comparison allows organizations to plan improvements or adapt specific best practices, usually with the aim of increasing some aspect of performance. Benchmarking may be a one-off event, but is often treated as an ongoing process in which organizations seek to continuously improve their practices.
The term “best practice” refers to a method or technique that has consistently shown results superior to those achieved with other means. A best practice often becomes an industry standard; practices follow a standard business process that has been proven to maximize business profits and patient standards of care.
The Value of Time, a Productivity Benchmark
We can always find or earn more money, but lost time is gone forever. If your practice employees work 40 hours per week and 52 weeks per year, they will have worked 2,080 hours per year. But do they really work that much? There are paid breaks, holidays, vacations and other paid time off where the employee is not available to work.
The national analysis of effective labor rates reveals that the average employee is available for productive work 1,934 hours per year. A national analysis also tells us that, although we may think we’re working 40 hours a week, our productive work time is actually closer to 65 percent of work hours. In this case, the benchmark is 65% of 1,934 hours, or 1,257 productive work hours per person. Is that percentage acceptable and realistic in the equine veterinary industry? What are your practice’s labor performance numbers and can these metrics help you improve productivity and profitability?
To illustrate the value of this benchmark (Figure 1), let’s look at the average revenue per person per productive minute. If the practice has 10 employees, each working 1,257 productive hours per year, the total hours are 12,570.
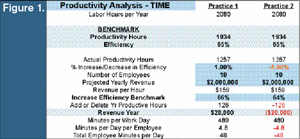
Using yearly projected revenue of $2 million, each worker then produces $159 of revenue per productive hour. If we want to improve our efficiency by 1%, from 65% to 66%, we would need to add 126 hours to our yearly productive time. Applying the revenue of $159 per productive hour per person, a 1% efficiency improvement has the potential adding $20,000 to annual revenue. That 1% improvement in efficiency in the normal 8-hour or 480-minute workday of available work time constitutes 4.8 minutes per employee per day.
That means that total time for 10 employees is 48 minutes per day.
The benchmark clearly demonstrates that just 4.8 minutes per person per work day will generate 1% increase in efficiency.
Figure 1 demonstrates that increasing or decreasing the benchmark productivity efficiency by as little as 1% has the potential to sizably change annual revenue.
Although this example looks like a benchmark for a manufacturing production line and may not appear to be relevant to an equine veterinary practice, this process enables the practice owner to accurately define and maximize work responsibilities and habits. In equine practice, the two greatest costs are labor and inventory. Benchmarking with colleagues and groups on those two key expenses will improve your bottom line quickly.
True Costs of Labor, a Financial Benchmark
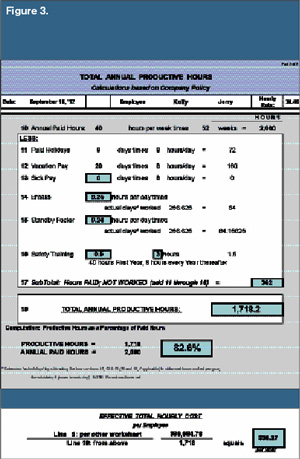
For this benchmark we look at the employee’s true labor cost consumption. We are all familiar with the specific cost of hourly wages, FICA, FUTA, SUTA, Medicare State Unemployment Insurance and Workman’s Compensation. But how do we calculate the cost of vacation, holidays, sick leave, breaks, standby time, continuing education, retirement funding, safety and development training, etc.? The chart below is an example of one measurement tool that benchmarks “Productive Hours” against “Annual Paid Hours” (Figures 2 & 3). This example can be easily modified and expanded for your unique setting and labor policies for veterinarians, managers and support staff.
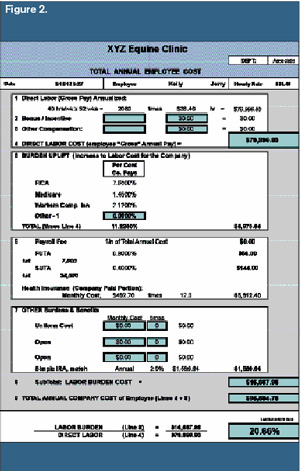
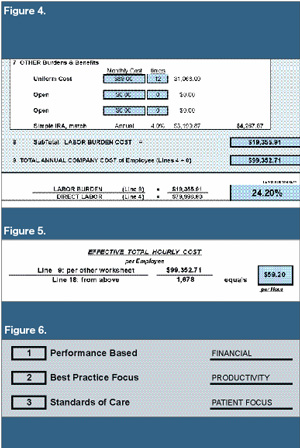
The National Analysis of Labor Productivity reveals an average labor burden rate of 22.6 percent for the average veterinarian practice. In the example, one can see that the actual hourly cost for this employee is not the actual pay rate of $38.46 per hour, but $56.27 per hour. As you can see this example beats the national analysis average by 1.74%. But what if we add benefits such as a monthly uniform cost of $189 a month, or $2,668 per year, and increase the company’s IRA contribution by 2%, as well as increase vacation by five days? The labor burden rate increases to 25.7%, the hourly cost increases to $59.92 an hour. That brings the true cost increase of 3.34%; $2.93 per hour, or $6,094.40 per year. Small labor changes may have a substantial financial impact on the profitability of your business.
Since labor is a cost that directly reflects profits, the obvious questions are:
1) If the practice’s labor rates are not within the National Productivity Analysis, are your retail prices competitive?
2) How much additional revenue must this veterinarian generate to offset the practice’s increased costs of $6,094.40 per year?
3) Are the practice’s margin adequate or within industry standards?
4) Are the employees supporting the practice or is the practice supporting its employees?
One must also take into consideration the competitive labor market in your area. What is the cost to keep highly skilled employees, and what jobs need high cost labor vs. seasonal or temporary labor support? Using the benchmark as a standard for employee compensation can help practice owners identify various ways to add profits or eliminate costs to the bottom line.
How to Get Started
Peer benchmarking is the No. 1 tool available for practice owners to improve their performance. Is this kind of information available? In most cases, the answer is yes. The first place to look is in special study groups like VMG (Veterinary Management Groups) or work with veterinary industry consultants, accounting resources or professional affiliations like VetPartners, etc. Every day new opportunities and tools are available (Google search) and you can also visit with colleagues. If no one in your area currently gathers and publishes peer data, launch an initiative to get this important information in place. One method is to get a group of practices to agree to provide some basic data along with financial statements in a blind or confidential manner. Then somebody crunches the numbers, develops a report and publishes the data.
Another resource to investigate is the Risk Management Association (RMA)’s “Annual Statement Studies.” RMA is a not-for-profit that gathers financial statements and relevant data of small- and mid-size private companies, aggregates them and publishes the results. The data is provided by financial institutions such as banks that loan money to businesses and are members of RMA. The data is provided on a blind basis (i.e., identities of the businesses are not revealed) and the sole purpose is, according to the association, to advance the use of sound risk principles in the financial services industry.
How do you start the process of comparing peer data to your company data? First, organize your own financial statements in a manner that mirrors the peer data you obtain. Calculate the various financial and productivity ratios in the same manner as the peer data.
Second, identify areas where your practice appears to underperform. There can be many explanations for a large deviation. You may consider consulting with your accountant because accounting policy and/or methodology can be a key factor.
Third, identify which area, if improved, would have the greatest positive impact to the practice. Fourth, develop a strategy for improving practice performance in your target area. This may include investigating how some of your peers achieve better results than you. Corner a few business owners and/or managers who are open and helpful.
Finally, track the practice’s progress. Garner your employees’ support Involve them in the pursuit of improvement. Set goals and consider offering incentives. Remember that the quality of the information is always the result of the quality of the data input. So know where and how your comparative information is gathered.
Key to Successful Benchmarking
Business success can be attained when the owner/practitioner and manager analyze and implement changes obtained from surveys, research data, group benchmarking and internal benchmarking, also monitoring the company’s financial health to improve operational efficiency and make proactive decisions. The key is being proactive, and not managing in a reactionary manner if you are too busy being a veterinarian.
These decisions are derived in part from quality data and comparisons both internally and in the marketplace. The examples above describe a small portion of the kinds of benchmarking that fit the equine practice. They can be used to develop a “dashboard” of key service performance indicators (Figure 6).
Summary
Benchmarking is a powerful tool in understanding and managing many key performance indicators to improve profitability, reduce owner’s management time, develop a sustainable business and provide superior service and care to patients and customers. The two examples used for this article demonstrate that individual practice knowledge alone, without good information, offers a view of only one side of the coin.
Without benchmark standards to compare performance in a proactive manner, the equine veterinary practitioner will be making business decisions without complete information. These benchmarks will provide help in developing changes that promote growth and prosperity for the practice.
Dr. Robert P. Magnus is the CEO and founder of Wisconsin Equine Clinic & Hospital. He runs Equine Business Management Strategies (EBMS) and founded Equine Best Practice, LLC, an equine practice financial services provider.