Part I of this article described our practitioner’s initial view of the company’s Profit & Loss Statement (also called the Income Statement). We discussed how the P&L should be organized and several reasons behind this method of organization, but what we did not tell you was that unless our practitioner collects cash at the time services and products are sold, the P&L will not be an accurate assessment of the company’s cash position! The P&L’s recording of cash payments is not in question, but the recording of a billable event, which is a promise to pay by the client, is affected by time.
This reality demonstrates that our practitioner provides services and/or products, sends out a bill, but doesn’t get paid for possibly 30, 60 or 90 days from the date the products and/or services were provided. Our practitioner, on the other hand, may have had to pay for the drugs and dressings, the overhead on his facility and equipment, as well as salaries before the practice gets paid for the products and/or services for which he has billed his client(s).
The P&L records the sale of products and/or services for the period in which it occurs. The revenue is billed, even though money has not changed hands (both invoiced and in accounts receivable). The costs may not be the ones for which the company wrote checks, but are those costs incurred generating the sales during the same time period. The P&L is a picture of the transactions that happened during a specific time period where revenue is matched against expenses.
The P&L does not measure the actual cash in our practitioner’s account; the Cash Flow Statement will do that. (See the article “Cash, It’s Always About Cash” in the Spring 2013 edition of EquiManagement.) Over time, the P&L and Cash Flow Statement will track one another as profit is turned into cash. The P&L measures whether the revenue for services and products add up to either a profit or loss. At the end of the day, just because the books show a gross profit, it does not mean the veterinarian’s practice has cash in the bank.
The Profit & Loss Statement illustrates the activity of your business over a discrete period of time. The practitioner needs to understand that he or she cannot spend the bottom line profit because it is not the cash in the bank. The actual cash in the practice account may not be profit, but the money required to keep the practice solvent (running) between the billing and receipt of payment from the client.
Let’s take a closer look at the income statement and gain a better understanding of how profit is reported and how it affects the cash you have to pay bills.
On Paper or In the Bank?
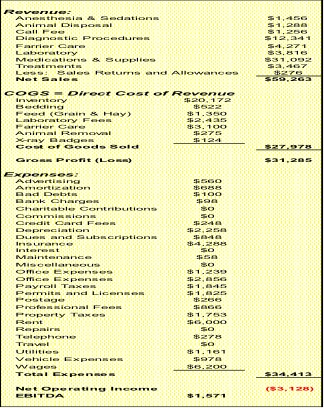
Returning to our example and illustration from Part 1 of this two-part series on the Income Statements (at right), our practitioner’s P&L bottom line is a negative number ($3,128), but EBITDA (earnings before interest, taxes, depreciation and amortization) is a positive $1,571, so did our practitioner make a profit on paper, or did he generate positive cash for the business (money in the bank)?
The answer to that question is found in the component definition of EBITDA. Our P&L has what accountants call “Non-Cash” Expenses; these amounts are charged as an expense, but not actually paid out in cash. Depreciation is where our practitioner’s accountant deducts a certain amount each month for equipment that was acquired in a previous period. This is an event that directly affects your income taxes and the profit reported on the income statement. Several line-item expenses toward the bottom of the P&L affect the net income, and it’s a good time to discuss these. Depreciation is sometimes a confusing business activity that may have a profound effect on your reports and the taxes you pay each year. For example, if you need to purchase an ambulatory vehicle and use cash to pay for it, the expense of the purchase of that asset isn’t recorded that month. The accountant allocates that expense (depreciates it) a little at a time over the projected life of the truck. In reality, no money is going out the door; rather, this month’s revenue depends upon using that truck, so the P&L has an expense line that depicts the appropriate monthly cost for the truck, which indirectly reflects a portion of the revenue the truck has generated by the veterinarian.
Amortization is the same basic idea, but applies to intangible assets such as patents, copyrights and good will. They are assets that cost money to acquire, but are not physical assets like real estate or equipment. Again, it’s another accounting adjustment that is not a cash activity, but it is reported on the P&L and affects the bottom line numbers.
Interest and taxes are all calculated and deducted as expenses each month even though they may not have been actually paid out that month. One-time charges are those costs that do not fit as a direct consumable expense (Cost of Goods Sold), or as operating expenses. They are generally listed as “other income/expense,” usually from the gain or loss from selling assets or transactions that do not relate to the everyday operation of the business.
Let’s go back to the first table in this story. Did the practitioner make a profit? The answer is no; the first three months of business generated $1,571 of positive cash, but didn’t make a profit!
What is Profit?
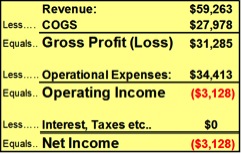
Profit is the positive or negative number left after all expenses are subtracted from revenue. Our practitioner has identified the three types of profit: Gross Profit, Operating Income and Net Income (see table at right). Each one is determined by subtracting specific categories of Expense from Revenue.
Gross Profit is simply revenue less COGS (cost of goods sold). Once the company has paid its direct costs for delivering its service or products, what’s left is gross profit. This can be greatly affected by either our practitioner or his accountant’s choice of when to book revenue and its related costs.
Operating Income is the gross profit less operating expenses. This is the positive or negative number left after running the business. This is a fairly sound indicator of how our practitioner is managing his company. Bankers will look at operating income to determine if the company is able to pay its debts and earn money for its owners. Operating expenses are considered “fixed”—that is, the total amount of money it takes to keep the doors open.
Net Income is the bottom line! Net income is also known by other names such as retained earnings or net profit. This is the positive or negative number left after COG, operating expenses, non-cash expenses, one-time charges, interest and taxes are subtracted from revenue. In our example (Figure 1) our practitioner’s accountant has not listed any one-time charges, interest or taxes probably because that information may not be completely available within the first three months of a new business. It is important to remember this fact in tax planning. At the end of the year your P&L net income may be significantly different than what you expected due to these expense line items.
The P&L statement illustrates over time how this practice is financially performing and what parts of this business are the most profitable and what parts have the highest costs.
But let’s dig in a little further and investigate the practice’s “break-even” point, as well as what margins are necessary to make the desired profit.
Financially Measuring Up
The graphs below take the practitioner’s quarterly revenue, COG and expenses, all from our P&L, to offer a wealth of information for our practitioner to see how his practice financially measures up to expectations on an annual basis. This may seem a bit overwhelming to analyze your business this way, but over time and with help from your accountant, VMG group or other advisors, unique reports like this will be invaluable to managing and growing your business.
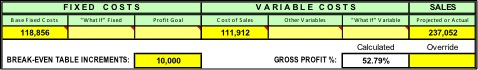
Beginning at the top of our chart we input our P&L components: Revenue COG & Expenses, and the increment with which we want our table to display the data.
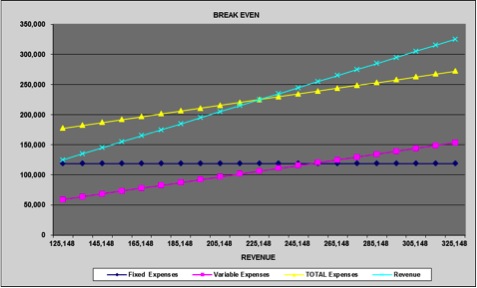
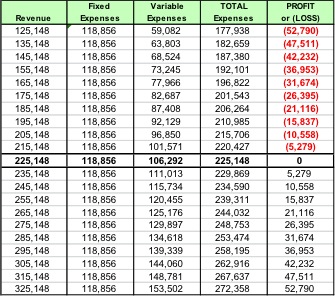
In the graph at right we see a Table that maps our Fixed (Blue) and Variable (Pink) Expenses separately from the Total Expense (Yellow) line, against the Revenue (Turquoise) Line.
Our “break-even” point is where the Total Expense (Yellow) and Revenue (Turquoise) lines cross, which depicts gross revenue break even at $225,148.
The below table demonstrates in $10,000 increments the Profit or Loss the Practice will experience as Revenue incrementally increases or decreases on either side of the Break-Even Point.
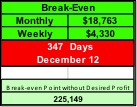
In the small chart below we see that our practitioner will need to generate sales of $18,763 per month, or $4,330 per week, just to maintain a break-even level. At the current rate the practice does not reach break-even until 347 days have passed, or Dec. 12 of the current year. But if our practitioner is able to increase revenue, the corresponding profit and the percent of sales are also listed.
The key to this chart is realizing how fixed and variable costs affect margins and profitability. At the very top of the chart our practitioner can utilize the “What If” boxes and forecast different Fixed and/or Variable Costs. If our practitioner were able to negotiate lower pharmaceutical costs, he could lower the variable costs, which would increase profits. If our practitioner were able to lower his facility rental cost, that would also increase profit as well. If he were able to move some fixed costs to variable costs, that may also increase profit.
Your business advisor or practice manager can easily design management tools like this using Excel spreadsheets and pulling information from your P&L and other software reports.
Your accountant can take Figures 2-5 and create a quick, one-page report using all this information from your P&L Statement.
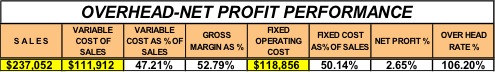
Now let’s go even further (chart below) and take those same P&L numbers and define what percentage are the real Fixed and Variable Costs and Margins.
Making Money
Unfortunately our practitioner is only averaging 2.65% margin for the products and services he sells.
I would bet that if you asked our practitioner how he established his retail pricing, he might say something like “Whatever the market will bear,” “I match my competition” or “I price my pharmaceuticals just a little below my competition.” That may be fine or sound good, but is it profitable?
Knowing your overhead percentage will help you establish your pricing model. The best practitioners are not only those that service their patients and clients well, but also those that understand the need for financial viability. The most important percentage in Figure 7 is the Overhead Rate %. This tells our practitioner that for every $1 in cost for a product or service, our practitioner must charge an additional $1.06, which equals a retail of $2.06, just to break even! Anything less will cost his practice real money!
Remember this is an example, and equine practices vary greatly in the overhead costs. It is important in any business to keep those costs to a minimum to maintain and improve profitability—equine practice is no different than any other service business. Three common management options are available to the practitioner:
Reduce the practice’s operational fixed costs. You can accomplish this by either eliminating or reducing any line item cost from the P&L. For example, reducing rent by moving to a smaller, less expensive facility, or re-financing any equipment, vehicle or building loan would lower monthly rates and, in turn, increase margins and profits.
Move any fixed costs to variable costs. This change would limit the cost to corresponding revenue. For example, could you move key employees from a fixed salary to full commission, or a variation of salary and commission? Could you re-negotiate rent to be paid based upon monthly revenue? All of these may increase margins and profits.
Charge more by increasing margins. Fee increases for professional services and product sales will increase revenue with the same fixed and variable costs, thereby increasing the practice’s net-profit percentage and lower the overhead rate percentage.
The best solution may not be any one of the three methods, but a combination of all three that will make the practice financially viable!
Take-Home Message
Most veterinary practices are seasonal by nature; it is not at all unreasonable to see swings in costs, profit and revenue move in different seasonally adjusted directions. Cash planning is crucial to meet the needs during the slow season. A well-designed P&L is the backbone of any practice. It is critical for the practitioner to define the relationship between the practice’s costs and revenue, which are the keys to a healthy, financially successful business.
Information from the Cash Flow Statement, Profit & Loss Statement and Balance Sheet—the core financial reports—and other management reports can be designed as quick, easy tools to help proactively manage your practice.
In the next issue, we will finish our series by tying everything together as we gain a better understanding of the Balance Sheet Report. Stay tuned!