
It’s no surprise that veterinarians generally prefer practicing medicine to crunching numbers. With a good accounting or veterinary practice management program, though, you can extract the numbers you need quickly and efficiently. These management reports are vital tools to improving your practice. From budgeting to productivity, a good set of management reports helps us spend more time doing what we love—practicing medicine—and makes our business stronger, if we know how to use them.
First, we need efficient and meaningful management reports that provide us with a snapshot of how the business is operating. Numbers mean nothing if they are not accurate and if you don’t know how to apply the information to your practice.
To understand how your business is performing, there must be ways to quantify information … as the saying goes, what gets measured gets managed. Begin by studying a small number of reports consistently each month until you are very comfortable with the information. Over time, develop a single report with multiple business metrics that can be viewed quickly to give you an overview of how your practice is performing.
Management reports should be easy to retrieve from your veterinary and accounting software. Other terms commonly used for these brief reports include: dashboard indicators, monthly business metrics, key performance indicators (KPIs), flash reports, etc.
As a non-MBA, how do you learn to interpret data accurately and understand what to look for? There are several resources available to help you—local and national business education programs, university and technical college courses, the AAEP business brief listserv, business advisors or accountants, equine consultants, even your friends and neighbors. With a little effort you can customize the reports to fit the needs of your specific practice. Proper use of management reports will help reduce unwanted surprises and assist in charting a successful course for a profitable and sustainable business.
The following examples will demonstrate how these reports provide information to better understand the business side of your practice. The majority of management reports detailed here come from veterinary management software, accounting software or a combination of the two. As you build and expand your business reporting structure, it is helpful to segregate the metrics into categories of reports; for example, Dashboard Reports, Financial Reports and Productivity & Performance Reports.
Dashboard Reports
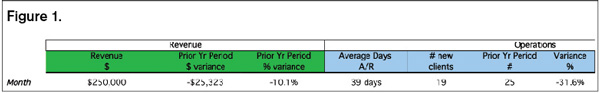
Figure 1 is an example of a basic dashboard report that might serve as a starting point report for measuring the financial health of your practice. This report is simple and concise, using metrics that incorporate aspects of revenue and daily operations. As you become comfortable with these metrics, consider other value drivers in your business, such as net profitability and individual doctor performance measures. These types of reports are meant to be read quickly and to help identify trends that may be off-target in some aspect of your business. The number of metrics may be small or expanded to a couple of dozen key areas that you want to monitor and on which to focus your attention. Most dashboard reports will change as your needs change.
Financial Reports
There are a host of financial reports that can be generated from your accounting system. The most common reports are standard financials—income statement, balance sheet, cash flow statement and the statement of equity. This is the foundation of financial reporting because these reports incorporate the revenue and expense sides of business operations along with the assets, liabilities and ownership. Each report provides insight into the company’s financial position from various perspectives. Although not discussed in detail here, it is important to understand each of the financial statement reports and review them regularly. From this basic information we are able to create a multitude of additional reports that help us better understand our business.
An active working budget is another financial report that is a necessary tool to keep on track and attain practice goals. Many businesses prepare an annual budget, store it in a drawer or file on the computer and then look at it again toward the end of the year. This create-and-ignore process does not help you adapt to changes in your business throughout the year. A budget should be reviewed and updated at the end of each month. Practice management reports will provide current practice financial data and help you meet your profitability targets. Also a monthly budget review is a great tool for year-end tax planning. Successful budgeting involves working with financial reports on a regular basis and adjusting your management tools to meet your core objectives.
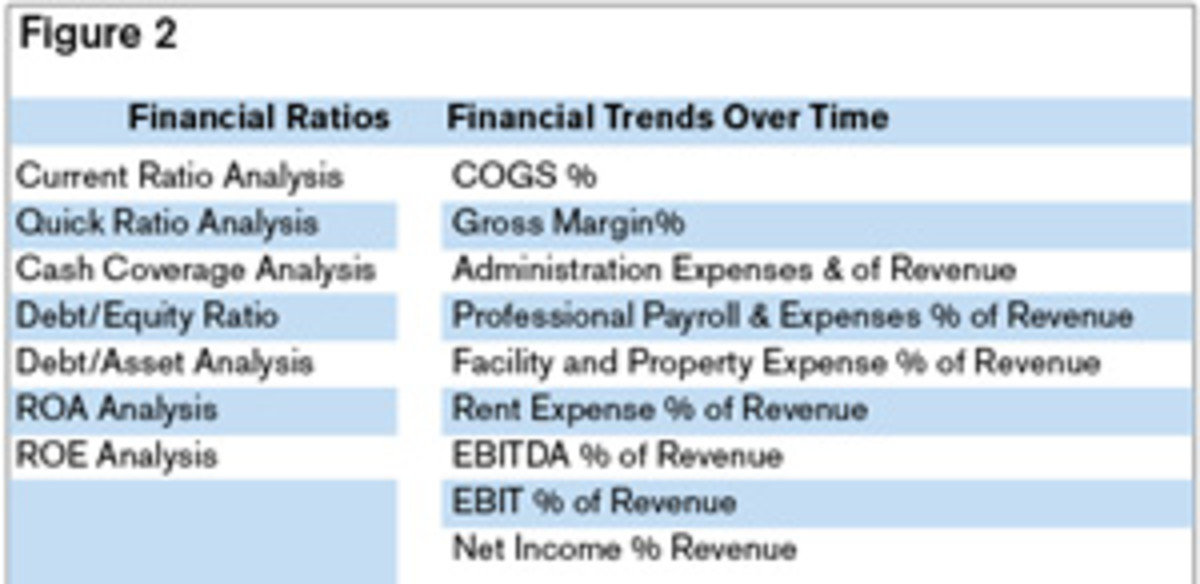
Other common and useful reports include financial ratios and trend reports for individual categories on your income statement (Figure 2). These metrics help you understand the overall health of your company and position your business for future growth, sustainability, improvement in value and potential sale. The number of reports in this category can appear overwhelming. To start the process, begin by selecting a few reports; then learn how they are calculated and what they mean. As time goes on, you can add more reports to your repertoire.
Productivity & Performance Reports
In any given business, specific resources are necessary to produce the valued services or products for sale. The greater the margin between the cost and the sales price, the greater the potential profitability of the business. Equine practice is no different. How we measure our productivity and performance is critical in managing the operations of the practice and future sustainability of the company. Maintaining and increasing the operating margin is critical to any successful business, especially in difficult economic times. There are costs in materials, labor, overhead and time that contribute to the success or failure of equine practice.
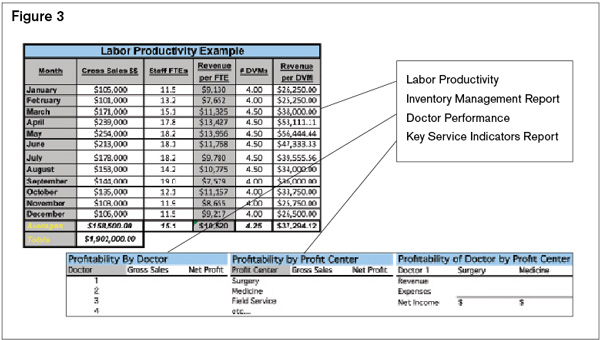
We veterinarians have a tendency to accept price increases from our suppliers, deal with fluctuating fuel prices, and accept staff wage and salary increases, but are very reluctant to pass these increases on to our clients as increased fees for services. Quite obviously, this cuts into our profit margins until we are working very hard for very little! There are many methods and metrics to use in monitoring your operational success (Figure 3). Focusing on the primary areas over which you have influence is a good place to start. These include, but are not limited to: labor costs, inventory control, DVM performance and service indicators that are special in your business.
SIDEBAR
Case Report
Brightside Equine Clinic (BEC) is a progressive four-and-a-half veterinarian ambulatory practice serving sport horses, a large reproductive clientele and pleasure horses. Nestled in a fairly affluent community, it enjoys a fairly stable economy even during the downturn. Recently, equine practitioners from outside the practice area have provided service to BEC’s current, established accounts. BEC’s owner is busy as usual, but three months into the new year, money is still tight and the craziness that comes with spring doesn’t seem to have hit the practice. The management report metrics paint a picture of the first quarter of 2012 and the impact on the business.
Questions:
Take a look at the reports below:
• What concerns you regarding BEC’s first-quarter business management health report for 2012?
• What are some options to improve the financial position of the BEC?
• What other metrics might you like to explore to help this company, and how would they be useful?
• Is a three-month trend the right time frame in this case?
• Is this a sustainable business?
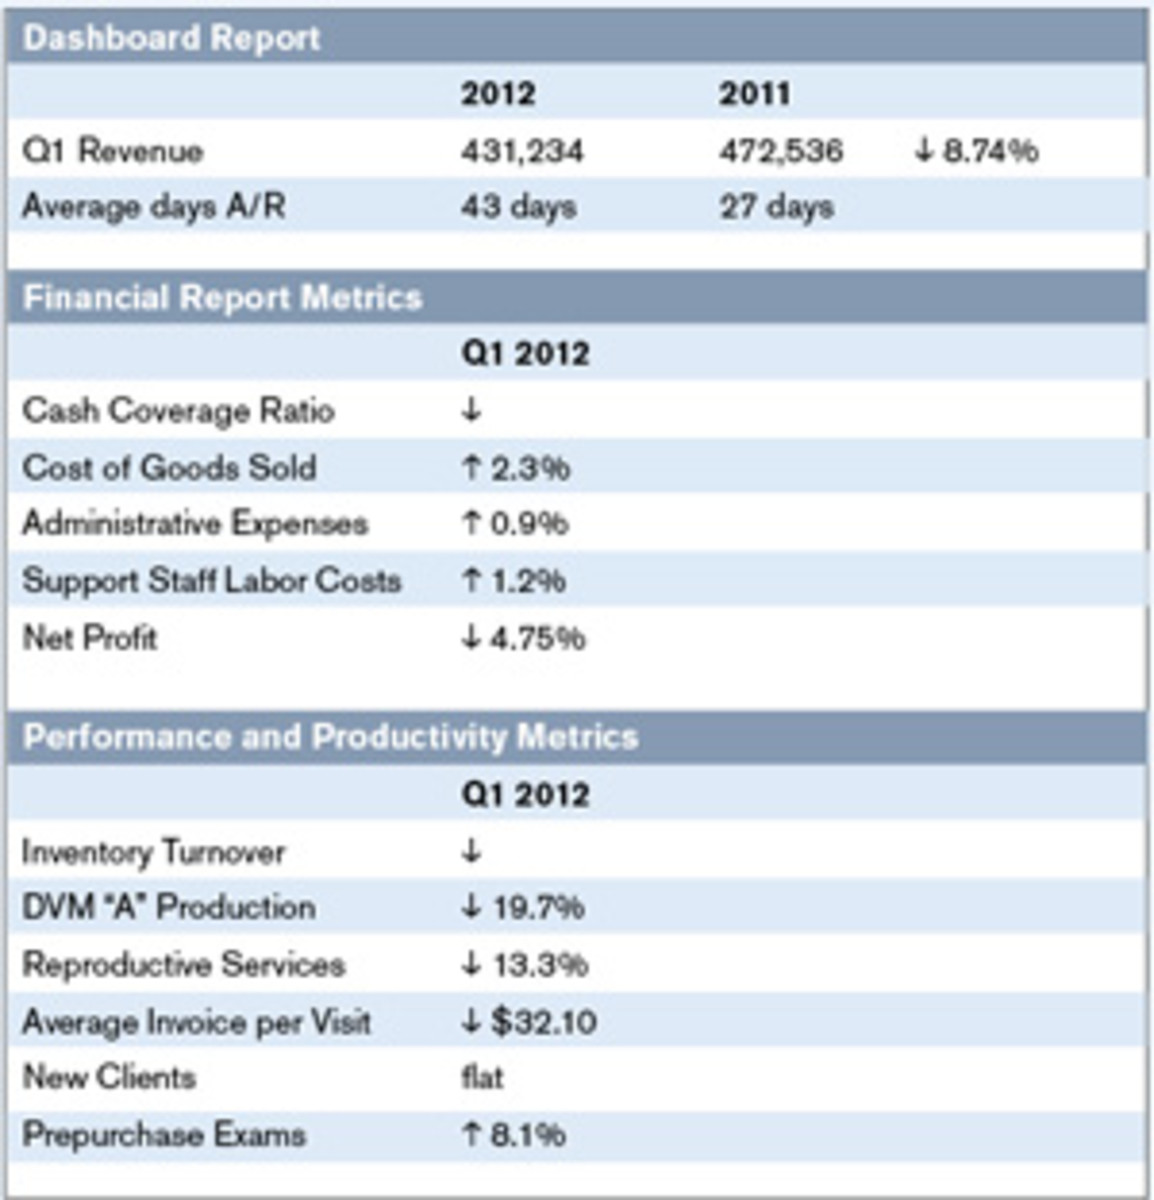
The case of Brightside Equine Clinic is an illustration of what commonly occurs in today’s marketplace as competition and an ever-changing economy forces each of us to provide better quality service to our clients and work to keep the core farm accounts that are the stability of the business. Each one of the metrics outlined in the charts is a piece of the puzzle that provides insight into the health of the practice. More importantly, these metrics provide clues for implementing changes and promoting growth and prosperity for the practice.
A detailed discussion addressing the questions from the sample case above may be found on the resource page of the website www.equinebusinessmanagmentstrategies.com. In addition, other management report templates in different styles may be downloaded to help you begin this process of customizing reports for your practice.
Dr. Robert P. Magnus is the CEO and founder of Wisconsin Equine Clinic & Hospital. In 2005 he developed Equine Business Management Strategies (EBMS).Recently he founded Equine Best Practices, LLC, a financial service provider for equine veterinary practices.