
In the first three parts of this series, we looked at the concept of strategic planning, the analysis of the external environment and the conditions of the competitive environment . In Part Four, we will discuss the competitor environment.
While in veterinary medicine we generally think of other practitioners as our professional colleagues, in a business analysis, other firms are deemed competitors. Although the term might make you uncomfortable, please know that while our discussion will involve competitors, you can still remain collegial and professional with the practices and veterinarians around you.
When considering your practice’s competitors, you can utilize a number of approaches to determine where your colleagues will challenge you most successfully and pose the greatest threat to your continued growth and profitability.
Strategic Group Analysis
A strategic group analysis (SGA) explores the scope of practice competitors, where scope is defined as the extent of the area or services that the practice can provide or to which they are relevant.
In SGA, a map is created whereby each axis represents an element around which firms tend to compete. Some examples of dimensions around which equine veterinary firms might compete are scope of service offering, geographic reach, level of facility capabilities, price, presence of specialists, etc. Your knowledge of what drives competition in your sector of practice (e.g. racetrack, rodeo, general practice) and your region of the equine veterinary industry will determine the competitive factors for this analysis.
Once the map axes are determined, competitors are plotted, and those that are located closely together are identified as direct competitors. However, all competitors in a strategic group map can ultimately be competitors, as service offerings and other elements of scope can shift depending on the attractiveness of demand and the available profit margins. Since there are only two axes, there are times where you might want to use more than one SGA map to determine your closest competitors. This is usually the case if you aren’t certain of the most salient competitive issues.
In the example below, a large equine practice has used SGA to evaluate the vulnerability of surrounding practices to the growing number of equine practices in their region by using their degrees of specialization as the main factor. The practices have been awarded points for specialization according the scale in Figure 2, and the sum is recorded in the column labeled Degree of Specialization in Figure 1.
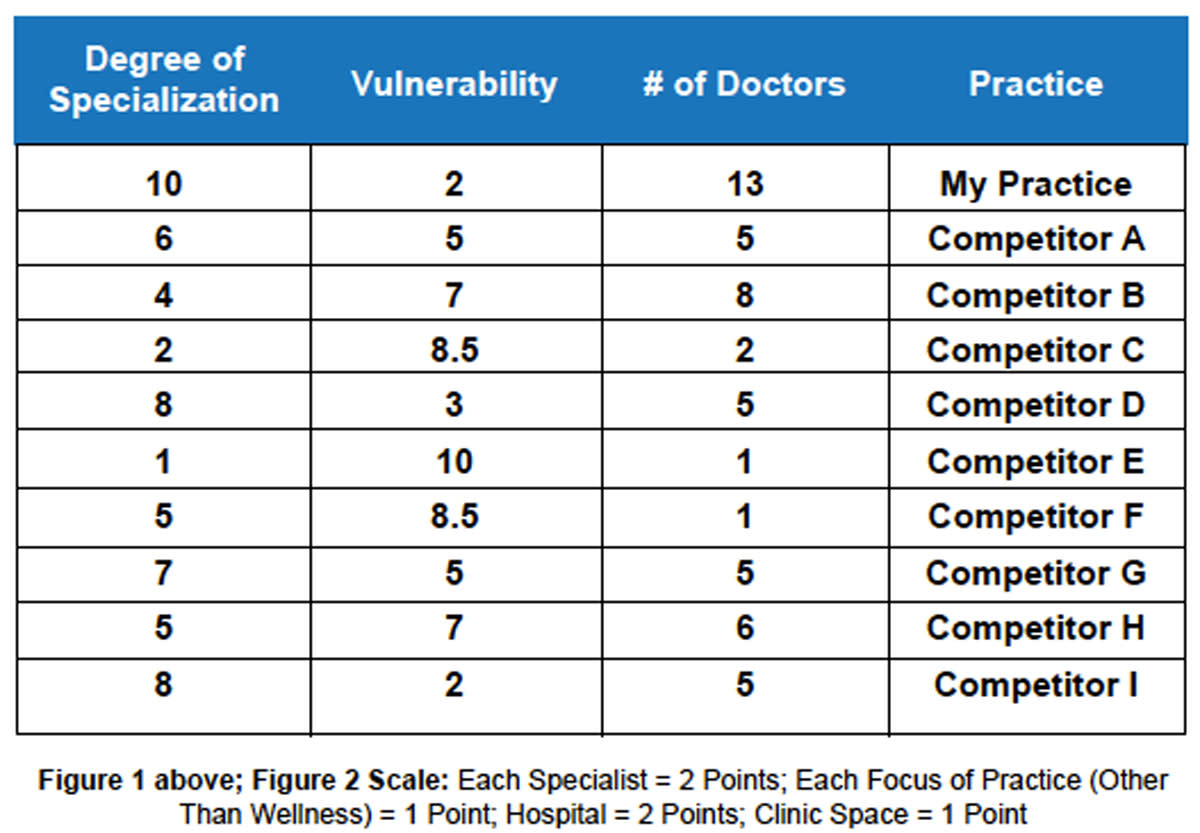
The degree of vulnerability is subjective in this example and has been determined by the analyst after careful consideration. In Figure 3, vulnerability is plotted against degree of specialization, with the size of the bubble determined by the number of doctors at the practice. The practices whose bubbles are nearest to the “My Practice” bubble (Competitors A and I) are those likely to be the most effective competitors of My Practice in this model.
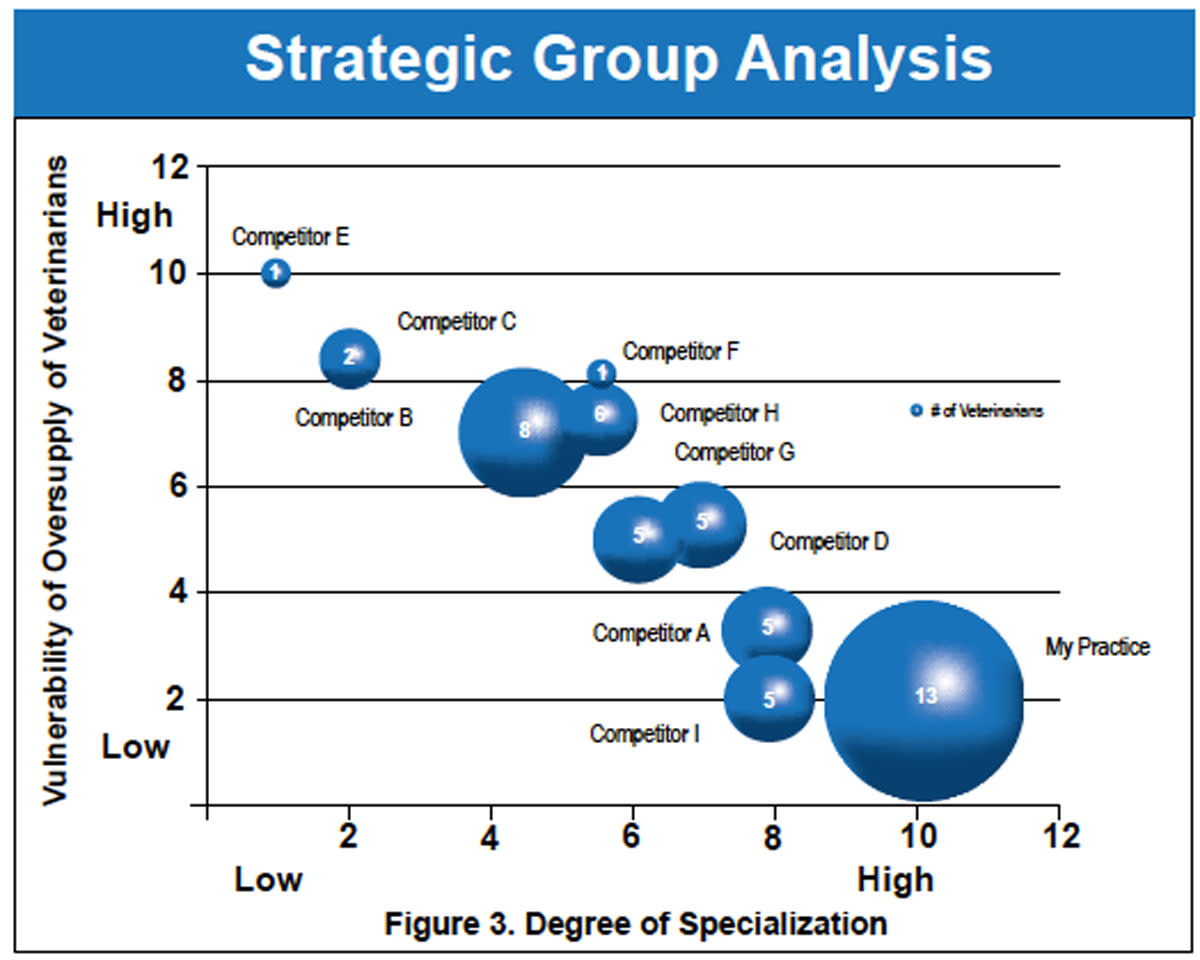
An alternative would have been to analyze the practices based on service prices or availability of advanced diagnostics. The factors that the analyst chooses to use will vary depending on the nature of the sector and region. It is important as scientists to be open to the subjective components of the analysis—and remember that you know quite a lot about your colleagues’ practices, even though you might not have actual data.
In this example, the analyst might have assumed that the practices with the most doctors would pose the biggest threat, but the SGA says otherwise. It can be helpful to do this analysis multiple times with different factors.
Key Success Factor Analysis
A key success factor (KSF) analysis extends the strategic group analysis and integrates some of the information from the competitive analysis covered in the last issue of EquiManagement . It identifies the key competitive issues in which a practice must demonstrate capabilities if it is to be successful.
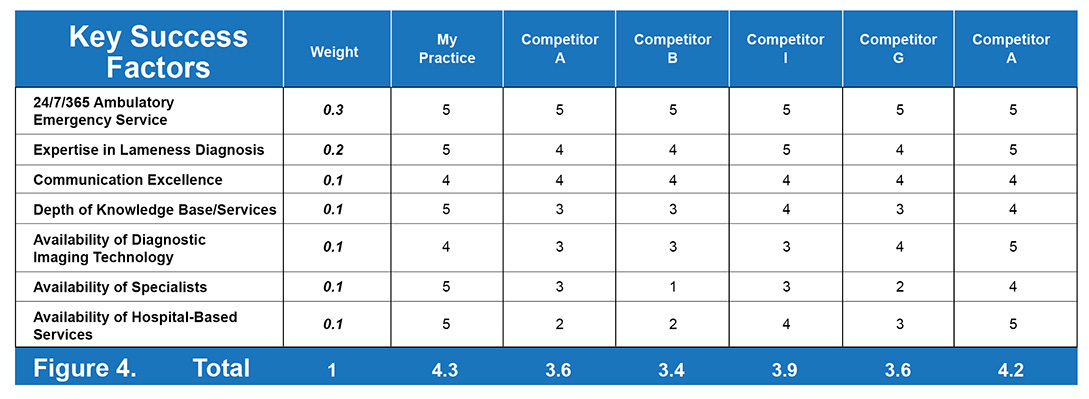
The chosen factors should not exceed 10. Each factor is given a weight allowing that the total KSF factor weight = 100%. Then, for each practice competitor, rate the level of competitiveness for each of the weighted factors using a 1-5 rating scheme, with 1 = least competitive to 5 = most competitive. These ratings should have some quantifiable justification when available; otherwise, simply understand how the ratings are distributed.
The weight and rating for each factor are multiplied; then all the factors are added together for a KSF score. This analysis provides a comparative view of what drives competition in the industry, how the key regional players stack up and your practice’s position in the stack.
The example in Figure 4 illustrates the use of the KSF with the practices whose bubbles were the closest to My Practice in the SGA. The analyst chose seven factors that he considered most important, and he made judgments about the competitor practices based on information gleaned from personal knowledge, websites and social media. The weights were assigned based on the analyst’s knowledge of what the region or segment’s clients value most highly in choosing a veterinarian. In this example, it is Competitor D that is the closest in performance to My Practice in KSF.
When utilizing these tools, it is necessary to be as honest as possible about your practice’s strengths and weaknesses, while accepting that you will be biased. Your concentration on your competitors’ profiles will prove to be revealing as you complete the exercise.
Porter’s Competitor Analysis
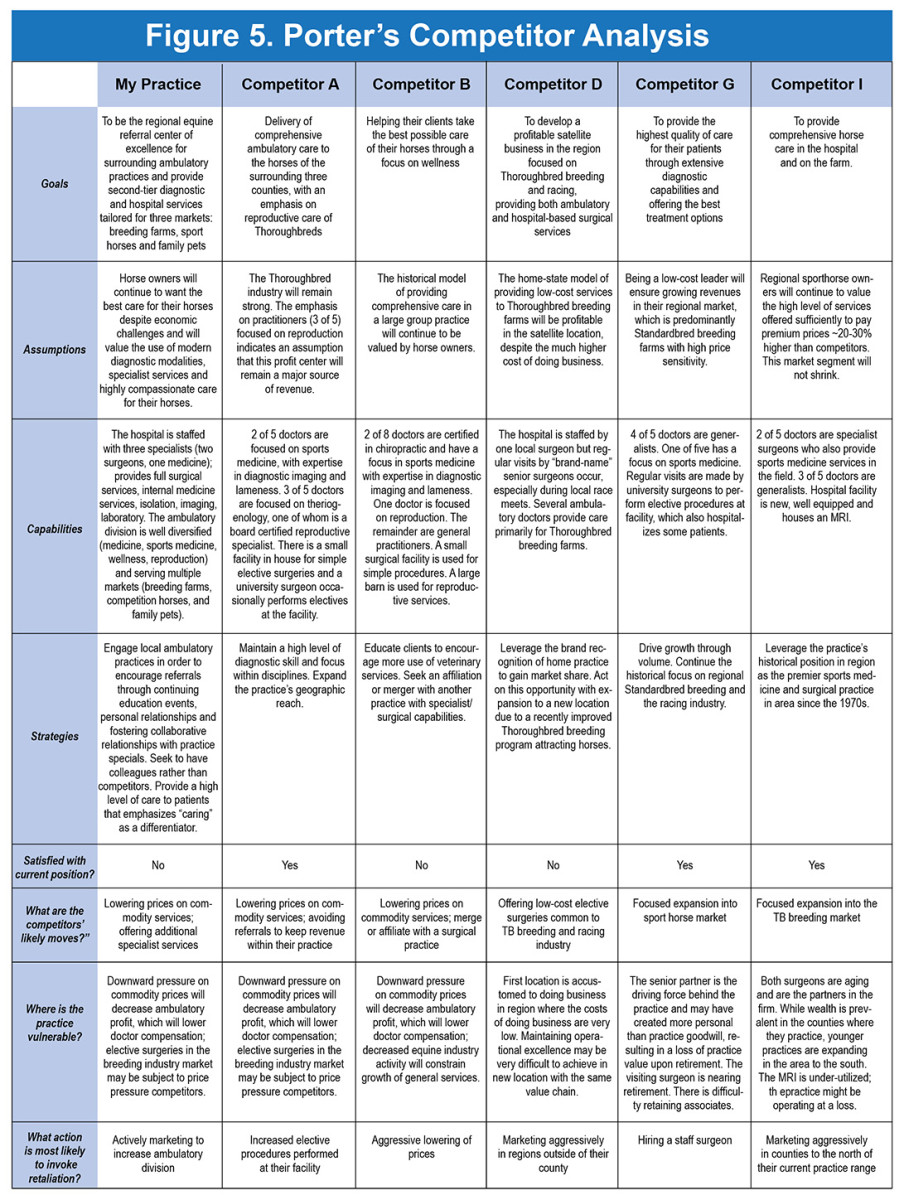
The Porter’s Competitor Analysis forces the analyst into the competitor’s mindset. It seeks to determine what a competitor is doing and why, as well as what a competitor can do and what the implications of that action would have for your practice. You ask four essential questions that serve as the heart of this analysis:
1. Is the competitor satisfied with its position?
2. What are the competitor’s likely moves?
3. Where is the competitor vulnerable?
4. What action of your practice is most likely to invoke retaliation? (e.g., loss of referrals, expansion into duplication of services, etc.)
In order to answer these four analytical questions, you must think carefully about your competitor’s goals, assumptions, current strategies and capabilities. Goals reflect what the competitor hopes to achieve and whether the business is achieving it. Assumptions revolve around a competitor’s beliefs about his or her practice, the industry and other competitors.
Strategies are what the competitor is currently doing, and whether the strategy represents a new direction. Capabilities address the practice’s strengths and weaknesses. Some of this information can be gathered from websites or social media, or from a practice owner’s interviews or articles.
A key purpose of competitor analysis is to consider how that business might respond to strategic moves by your practice, not just to try to predict what a competitor might do. If you build a hospital facility, will your competitor refer patients, or will he or she build a facility of his or her own?
Remember, strategic moves do not occur in a vacuum. Industries are open systems. A change created by any part of the system (e.g., practice expansion, governmental regulation, new technology) will alter the entire system. It is essential for you to also consider how shifts by one competitor can influence moves by another.
In the example on the opposite page, the analyst thought carefully about the practices that are his closest competitors. Using information from websites, social media and other sources, Figure 5 was completed, giving a clearer picture of the competitive environment. (See Figure 5 at the end of this article.)
Take-Home Message
After performing these competitor analyses, it is wise to formulate a written statement or brief notes about your interpretation of each analysis. It should demonstrate an integrated understanding of both the competitor and competitive arena and indicate the key challenges for the practice.
It is not a recommendation of what the firm should do. That will come at the end of the strategic analysis, after an internal audit is conducted (see our next installment in this series). The statement you prepare will simply help you recognize the key competitor issues that you will need to take into account when you form your strategy for the future at the end of this exercise.

![[Aggregator] Downloaded image for imported item #19769](https://s3.amazonaws.com/wp-s3-equimanagement.com/wp-content/uploads/2026/05/31141823/EDCC-Unbranded-11-scaled-1-768x512.jpeg)