Editor’s note: This equine veterinary survey is a follow-up to a December 2020 survey conducted by Amy Grice, VMD, MBA, for EquiManagement titled “Effects of the COVID-19 Pandemic on Equine Practice.” Grice’s 2020 article won the American Horse Publication’s top award in equine journalism for “Breaking News or Investigative Reporting Single Article” for that year. We appreciate all of the equine veterinarians who shared their honest, insightful, inspiring and sometimes critical views of the current equine veterinary industry in these surveys in order to help us build to a better future. Please note that Grice will delve deeper into these survey results and offer insights to what they mean in a pair of articles that will appear in the Spring 2022 EquiManagement print magazine. If you are a US-based equine or equine/mixed veterinarian and you are not receiving EquiManagement’s quarterly print magazine, please contact me at kbrown@equinenetwork.com. This article and the two articles in the spring magazine are brought to you by CareCredit.
As of the end of December 2021, more than 53 million people had been infected with coronavirus in the United States and at least 820,000 have died, according to a New York Times database.
After we all began the summer of 2021 with a sigh of relief as things began to return to normal, the Delta variant caused a wave of new illness and death, especially among the unvaccinated. When the new Omicron variant was discovered in late November 2021, the Dow Jones Industrial average lost 2.6% of its value in a single day, the worst performance since 2008. Despite volatile performance, the stock market regained much of its value for the year, closing on December 2 at 36,600 but roller-coastering a bit in subsequent weeks to close on December 31 at 36,338.
Economic performance projections for 2022 have been cautious. How the equine veterinary industry will fare is uncertain.
Vet Survey Demographics
In order to evaluate the effect of the ongoing 2021 pandemic challenges on equine veterinary practices, a survey was conducted by the author on behalf of EquiManagement. The sixteen-question survey link utilizing Survey Monkey was distributed on the closed Facebook groups Equine Vet-2-Vet and AAEP Member Vet Talk. In addition, a link to the survey was posted on the AAEP General Communities email listserv. The survey was open for 14 days (October 28–November 10, 2021); 312 veterinarians responded.
In order to utilize demographic information about the respondents in analyzing the results, questions included the number of years in practice, whether the respondent was an associate or an owner, the size and zip code zone of the practice, and the gender of the respondent. All of the questions allowed the veterinarians to write comments, and they wrote many to explain their answers.
Almost 12% of respondents had been in practice from one to five years, and about 22% had six to 10 years of experience. Around 19% of respondents had practiced for 11 to 15 years, about 14% had been practicing for 16 to 20 years, and just over 34% of respondents had been in the field more than 20 years.
About two-thirds of respondents (69%) indicated they are practice owners, about 28% said they are associates, and 3% indicated they were in academia. Around 77% of respondents were female, and 22% were male.
The respondents were fairly similar in their practice size to the 2016 AVMA AAEP Equine Economic Survey participants, with 38% solo (38.5% AVMA AAEP survey), 28% reporting 2-3 full-time equivalent (FTE) DVMs (26.9% AVMA AAEP survey), 19% at 4-6 FTE DVMs (13.9% with 4-5 DVMs in AVMA AAEP survey), and 15% with greater than six FTE DVMs (20.6% with 6 or greater DVMs in the AVMA AAEP survey).
Respondents were also asked what geographic zone they practiced in, and results indicated participation across regions, although Zip Code Zone 7, which includes Texas—the #1 state for horse population according to the American Horse Council’s 2017 study—had the least number of respondents (see Figure 1).
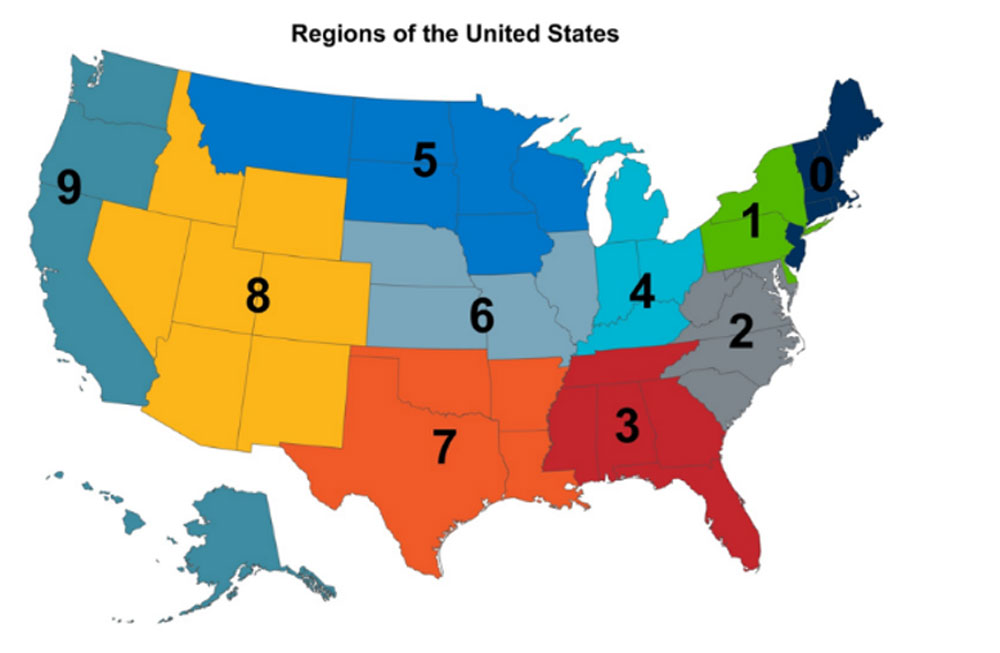
Zip Code Zones=Regions of the United States
- Zone 0—ME, VT, NH, MA, CT, RI NY—13.0%
- Zone 1—NY, PA, DE—11.0%
- Zone 2—MD, WV, NC, SC—12.0%
- Zone 3—TN, GA, FL, AL, MS—11.0%
- Zone 4—MI, IN, OH, KY—15%
- Zone 5—MT, ND, SD, IA, MN, WI—7.3%
- Zone 6—IL, MO, NE, KS—6.7%
- Zone 7—TX, AR, OK, LA—4.0%
- Zone 8—ID, WY, CO, UT, NM, AZ, NV—8.7%
- Zone 9—OR, WA, CA, AK, HI—11.3%
Figure 1. Percentage of Respondents and Zip Code Zones
Finding Non-Vet Help
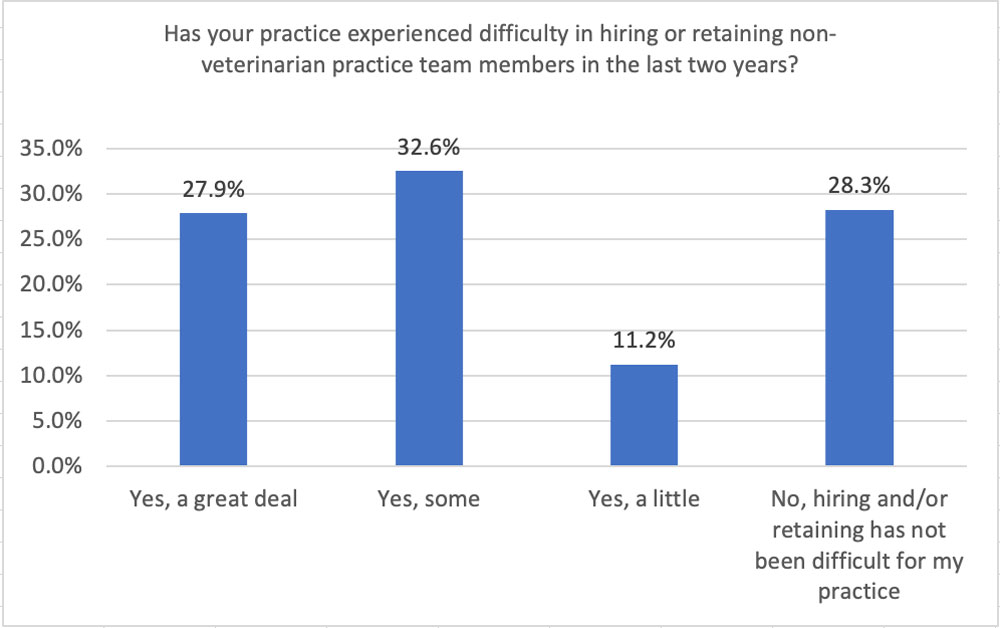
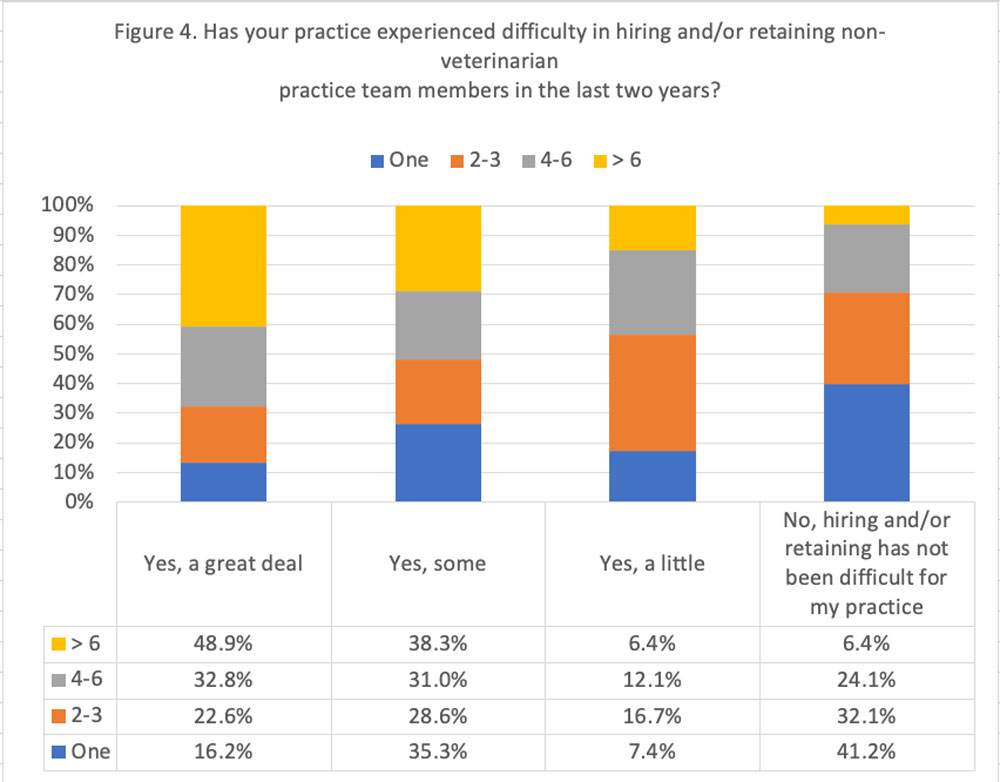
Respondents were asked “Has your practice experienced difficulty in hiring or retaining non-veterinarian practice team members in the last two years?” 27.9% of respondents said “Yes, a great deal”, 32.6% responded “Yes, some”, 11.2% responded “Yes, a little”, and 28.3% responded “No, hiring and/or retaining has not been difficult for my practice” (see Figure 2).
Fifty-three of 311 respondents (17% of the total) answered “No, my practice has no employees and is not trying to hire any.” Those 53 responses were not included when calculating the percentages of respondents who were seeking to hire and reported their level of difficulty.
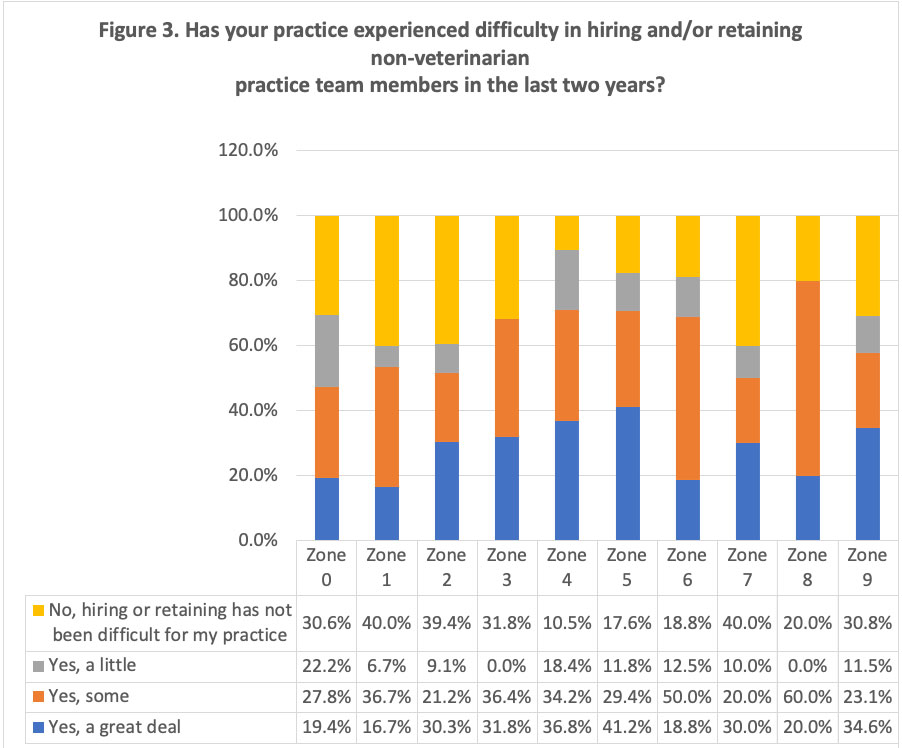
Looking at hiring and retention difficulties by Zip Code Zone (The zone number corresponds to the first number of each region’s zip code) showed some differences between regions. A great deal of difficulty in hiring and retaining lay staff was reported in Zone 5 (41.2%), Zone 4 (36.8%) and Zone 9 (34.6%). Those areas with the least difficulty in hiring non-veterinarian team members were Zones 1 (40.0%), 2 (39.4%), and 7 (40.0%). When additive responses were considered, Zones 4 and 5 reported the highest percentage of responses that indicated a great deal or some difficulty in hiring or retaining non-veterinarian team members, followed by Zones 2, 7 and 9.
Practice size had a noticeable effect on the difficulty in hiring and/or retaining non-veterinarian team members in 2020 and 2021. Large practices (those with over 6 full-time-equivalent veterinarians) had the most difficulty, with each successive practice size reporting less of a struggle. These results might seem counter-intuitive, but it is possible that larger practices had a higher need for new staff due to increased resignations, decreased job satisfaction or strong practice growth. This last factor is unclear, as the largest practices had the least number of respondents reporting that financial performance was a great deal better than in the previous two years.
It is interesting to observe that the number of respondents in this study who reported no employees in their practice (17%) is consistent with the 16% of respondents in the 2016 AVMA AAEP Equine Economic Survey who reported no employees.
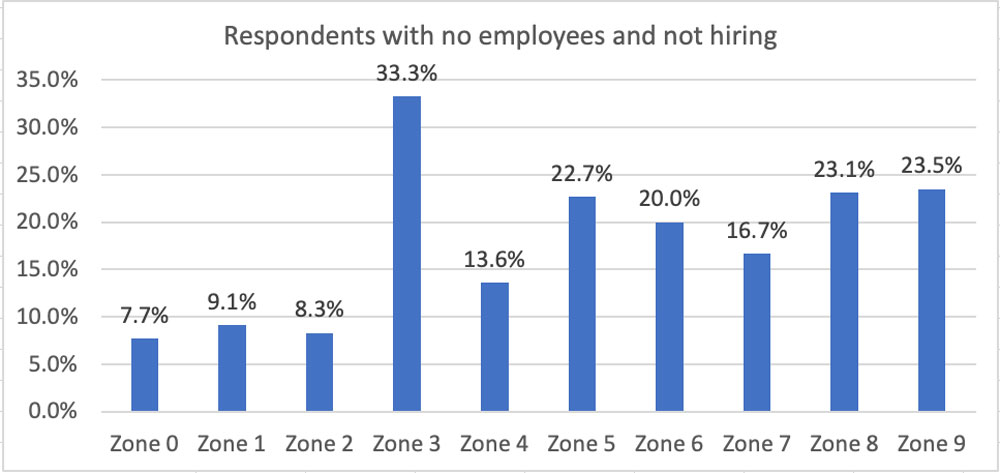
When looking at this question by zip code zones, there was quite a bit of variation (aee Figure 5). Zone 3 had the highest percentage of practitioners with no employees at 33.3%, representing 11 of the 33 respondents from that zone. Zones 5, 8 and 9 had about a quarter of respondents with no employees and who were not seeking to hire, with 5 of 22 respondents, 6 of 26 respondents, and 8 of 34 respondents, respectively, by zone.
Finding Associate Veterinarians
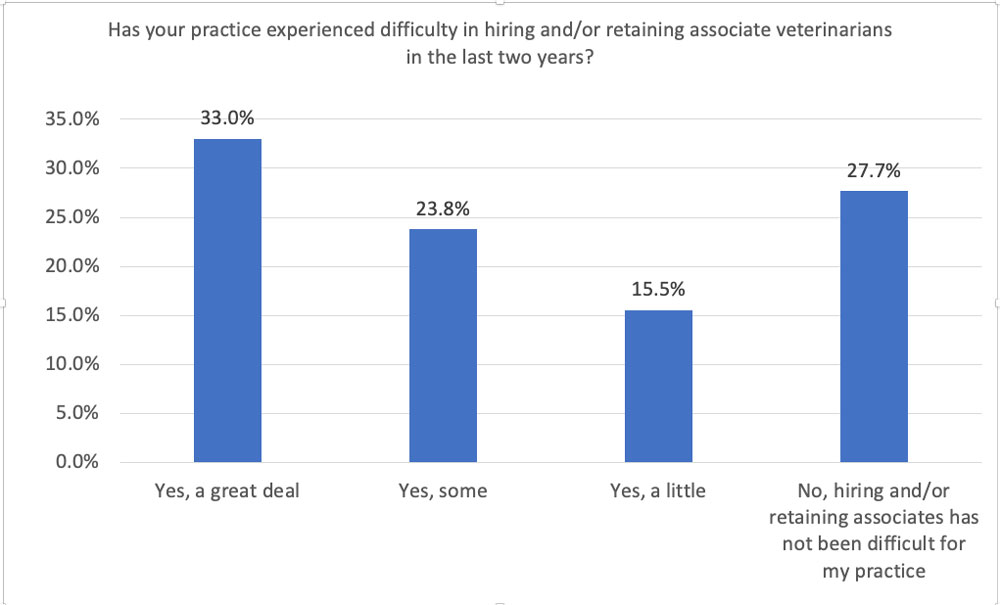
Survey respondents were asked if their practice had experienced difficulty in hiring and/or retaining associate veterinarians in the last two years (see Figure 6). When considering all respondents, a third (33%) replied that they experienced a great deal of difficulty and an additional 23.8% said they had some difficulty. Additively, 56.8% experienced some or a great deal of trouble in meeting their hiring and retention needs. About a quarter of respondents said that hiring and retaining associates had not posed a problem for their practices.
There were differences in hiring difficulty depending on the region of the country where respondents were practicing (see Figure 7). Zones 3 and 6 had the most responses indicating a great deal of difficulty in hiring or retention, at 44.4% and 45.5%, respectively, followed by Zone 7 at 42.9% and Zone 2 at 39.1%.
Forty percent of Zone 5 reported they were experiencing no difficulty in hiring or retaining associates, the highest of the different regions, followed by Zone 3 at 38.9% and Zone 1 at 37.5%. When all levels of difficulty were considered additively, Zone 4 far exceeded other areas at 94.3% in trouble retaining or hiring associate veterinarians.

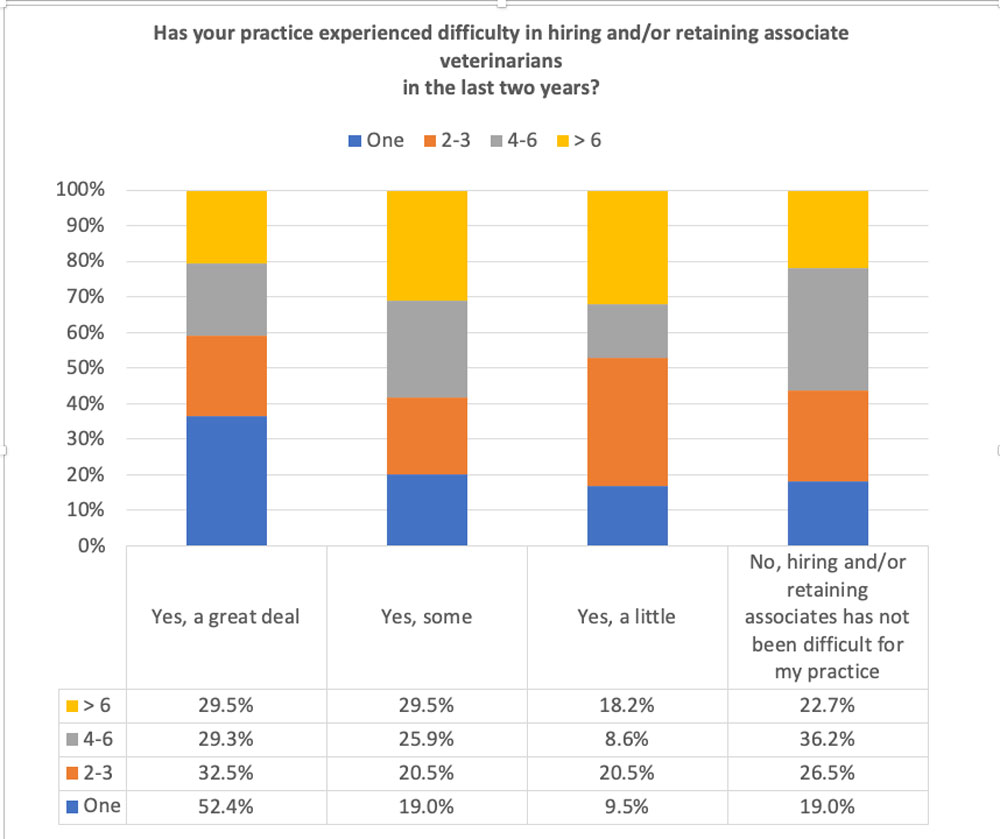
When analyzed by practice size, variation again was evident (see Figure 8). The data indicate that the sweet spot seemed to be in the smaller to moderately sized practices (but not solo) when considering additive difficulty levels, with 63.8% of 4-6 FTE DVM practices experiencing difficulty of any degree, followed by practices of 2-3 FTE DVMs at 73.5%, compared to 77.2% of practices of over 6 FTE DVMs. When looking at additive responses that reported only great or some difficulty, the 2-3 FTE DVM practices numbered 53.0% followed by those with 4-6 FTE DVM at 55.2%.
In contrast, 59.1% of large practices of over 6 FTE DVMs reported having great or some difficulty. As more large practices are acquired by corporate consolidators, job seekers could possibly be avoiding opportunities in a corporate setting, or associates might be leaving those positions. Additional specifics of these data were not collected in this survey, but knowing those facts would be interesting.
A practice with more than six DVMs commented, “Retaining vets has been the greater challenge, but I don’t think it is COVID-related as retention has been an issue for quite some time.”
Larger practices also might struggle to create a strong sense of belonging and community, aspects that are important to veterinarians’ wellbeing and job satisfaction due to busy schedules and stratification of owners and associates.
Those completing the survey wrote a number of comments, a few expressing gratitude that they had been able to hire fairly easily and many lamenting the current hiring landscape. As one shared, “We desperately need one and could probably use two associates to improve everyone’s quality of life and work/life balance. We have been looking for six months and have had only 2 resumes sent to us in that timeframe.”
Another said, “We had one vet leave for small animal in fall of 2020 and have had only two applicants since then, both of which found work elsewhere.”
Financial Performance of Equine Vet Practices
Financial performance of companion animal practices in the U.S. has been tracked weekly by VetSuccess with their Veterinary Industry Impact Tracker since March 2020. While there were some initial revenue drops, practices came roaring back with revenues that have steadily increased year over year by an average of 11.3% nationally, as of December 2021.
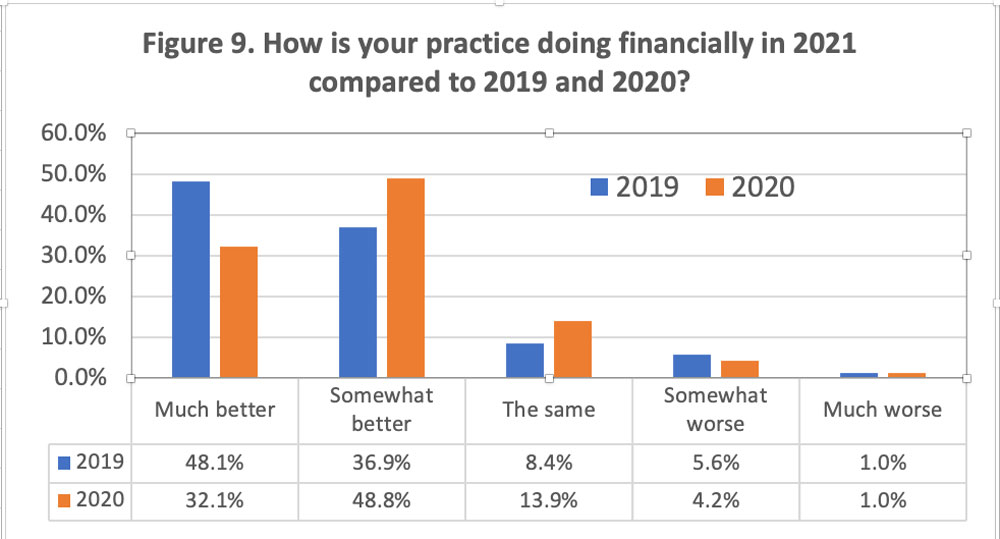
The survey of equine practices reported in this article sought to qualitatively measure the financial performance of equine practices by asking “How is your practice doing financially in 2021 compared to 2019?” And “How is your practice doing financially in 2021 compared to 2020?” (see Figure 9).
When looking at all respondents, 48.1% said “Much better” in 2021 compared to 2019 and 32.1% said “Much better” in 2021 than 2020. About a third said “Somewhat better” in 2021 than 2019 and about half said the same when comparing 2021 with 2020. Only 1.0% said “Much worse” in either year’s comparison.
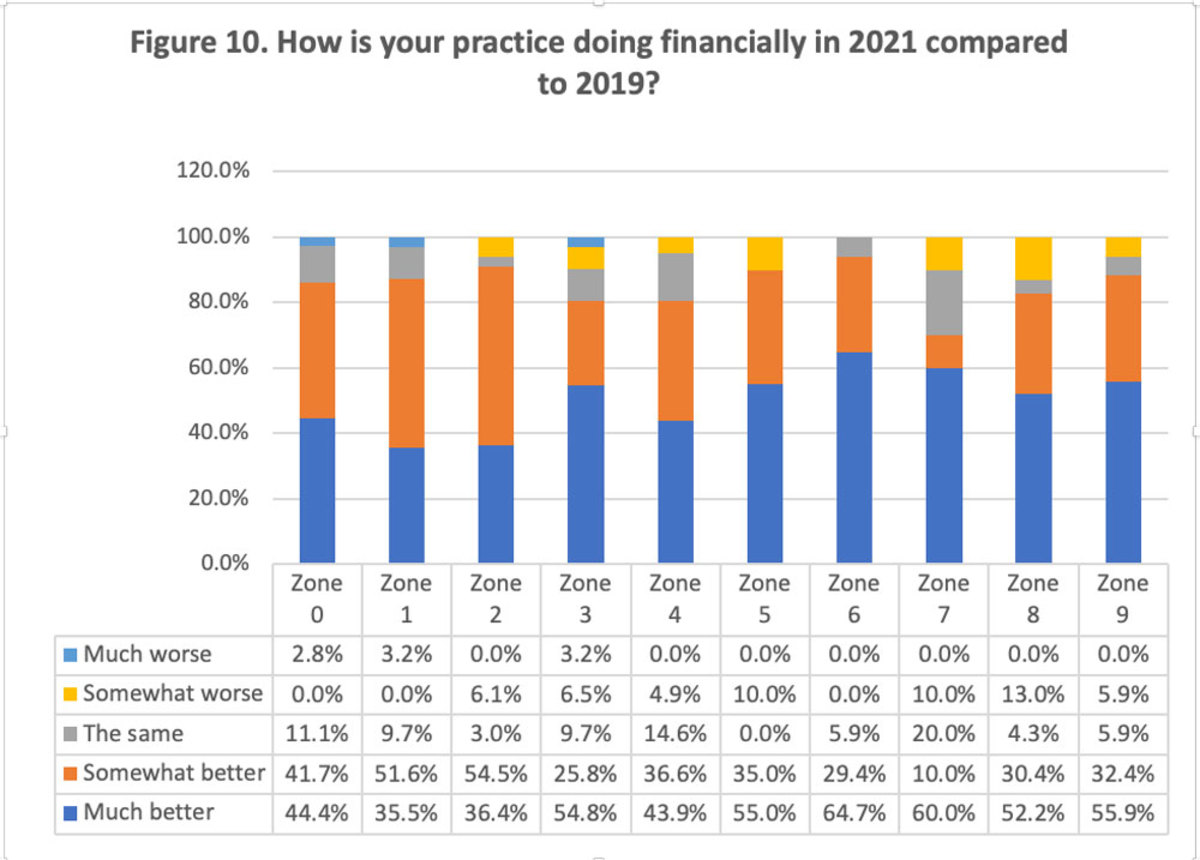
However, not unexpectedly, there were variations when responses were separated by Zip Code zone (see Figure 10). For performance in 2021 compared to 2019, practices in Zone 6 (64.7%) and Zone 7 (60.0%) reported the highest percentages of the response “Much better.” Other zones with many responses of much improved financial performance included Zone 3 (55.8%), Zone 5 (50%) and Zone 9 (55.9%). Most of the regions had no respondents who reported “Much worse” financial outcomes. Zones 0, 1 and 3 were the only zones with any of these responses.
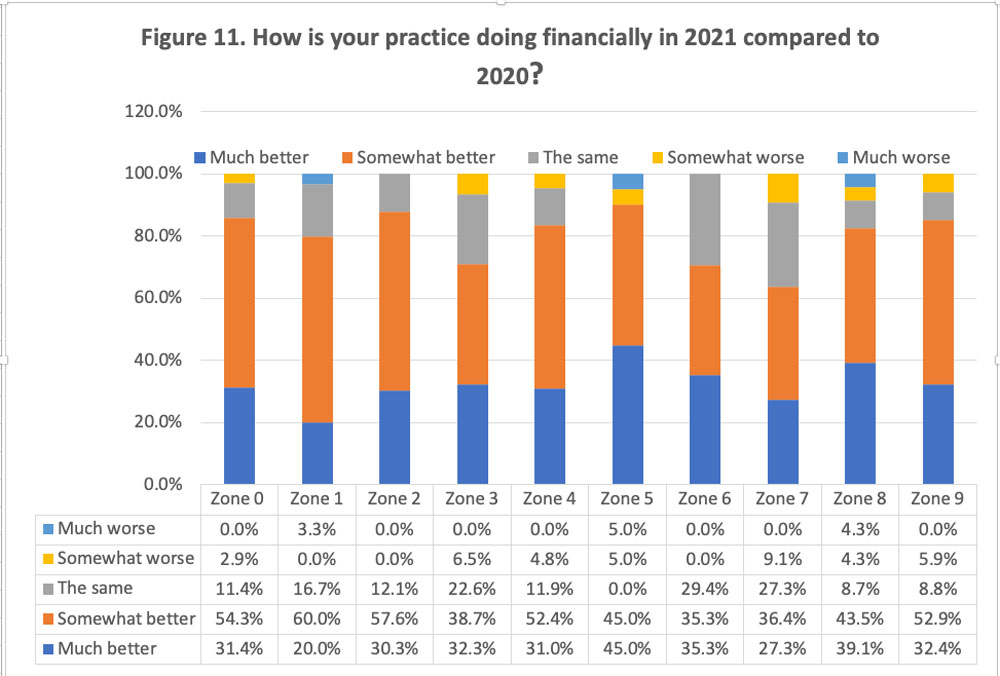
For comparisons of fiscal results between 2021 and 2020 (see Figure 11), practices in Zone 5 (45.0%) and Zone 8 (39.1%) reported the highest percentages of the response “Much better.” Other zones with many responses of much improved financial performance included Zone 6 (35.3%), Zone 9 (32.4%) and Zone 3 (32.3%).
Again, most of the regions had no respondents who reported “Much worse” financial outcomes. Zones 1, 5 and 8 were the only zones with any of these responses. Interestingly, Zones 5 and 8 also were also among those with the highest percentage of respondents reporting the best financial outcomes.
Hours Worked in Practice
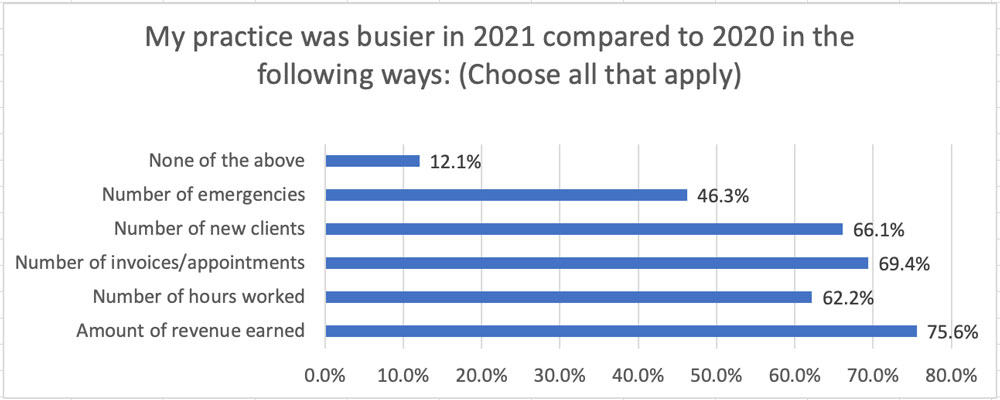
The survey also asked about the ways that practice was busier in 2020 and 2021 compared to the previous year (see Figures 12 and 13). Comparing 2020 to 2019, about two-thirds of respondents reported increases in the number of new clients, number of invoices and amount of revenue earned. About 60% worked more hours and 44.4% saw more emergencies. Only 13.5% saw none of these changes.
When looking at 2021 in comparison to 2020, the increase in workload continued and intensified. Three-quarters of respondents said revenue increased, and about two-thirds of respondents reported increases in the number of new clients, number of invoices and number of hours worked. The number of emergencies increased for 46.3% of respondents. 12.1% reported none of these increases.

Telemedicine
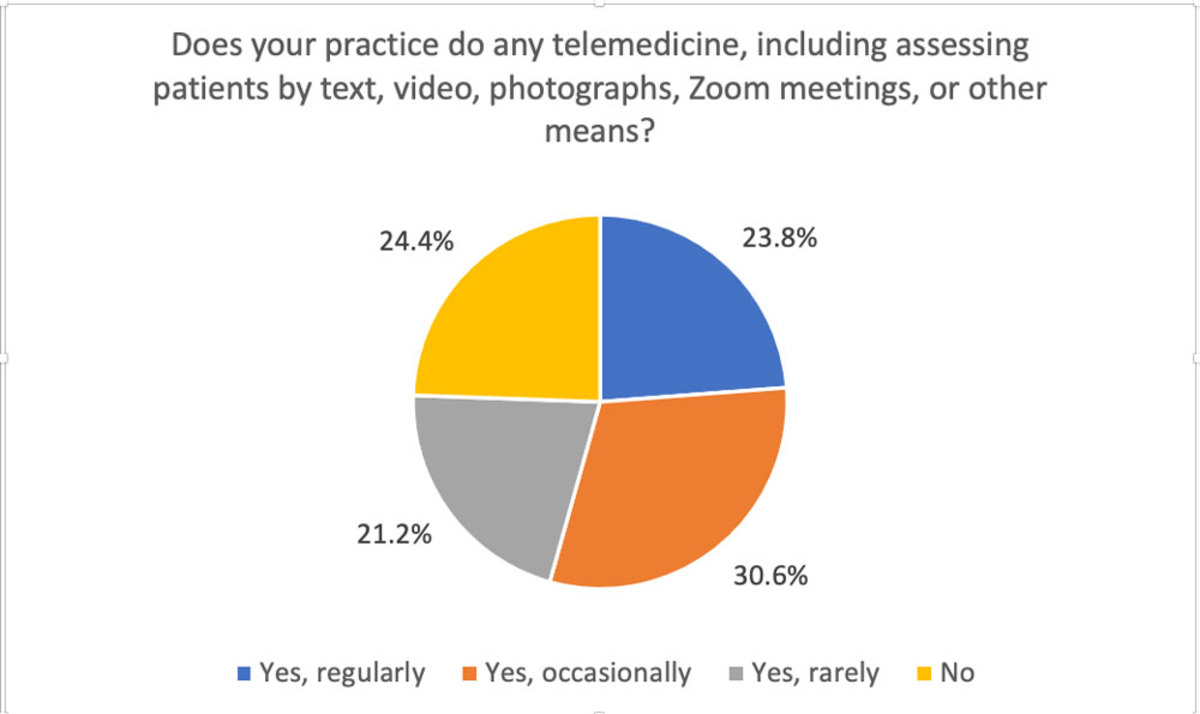
Respondents were also asked, “Does your practice do any telemedicine, including assessing patients by text, video, photographs, Zoom meetings or other means?” Responses were about equally divided between Regularly (23.8%), Occasionally (30.6%), Rarely (21.2%) and Never (24.4%) (see Figure 14).
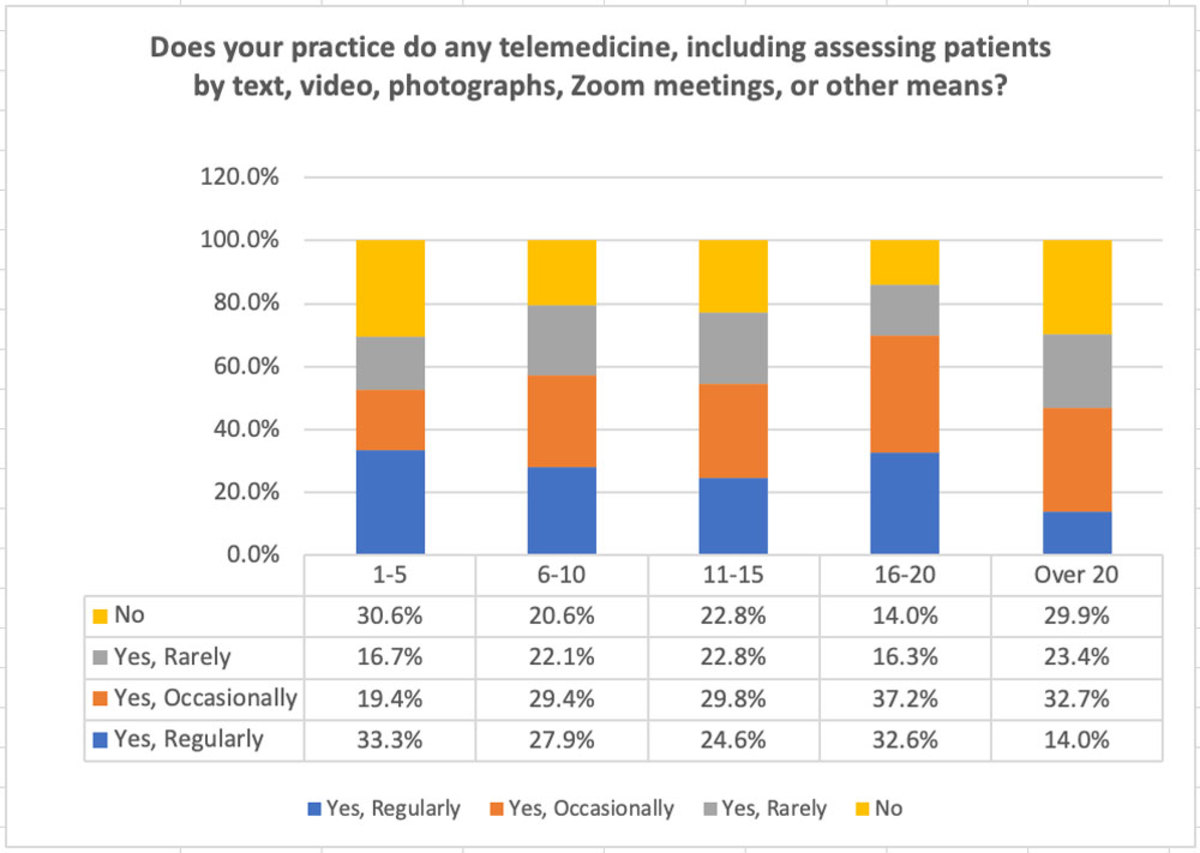
When these findings were divided by years in practice, surprising differences emerged. One might expect younger veterinarians to be most comfortable with new technologies, but in fact, those in practice for 16-20 years rivaled those in practice for 1-5 years for their regular use of telemedicine (32.6% versus 33.3%). When considered additively with regular as well as occasional use of telemedicine, those in practice 16-20 years exceeded all others at 69.8%, followed by those with 11-15 years and 6-10 years of experience (see Figure 15). Possibly older, more experienced practitioners have more confidence in their abilities to properly triage or evaluate cases remotely.
However, the highest response for regular use of telemedicine was reported by those with 1-5 years of experience (33.3%) as well as the highest percentage that do not use telemedicine at all (30.6%) (see Figure 15).
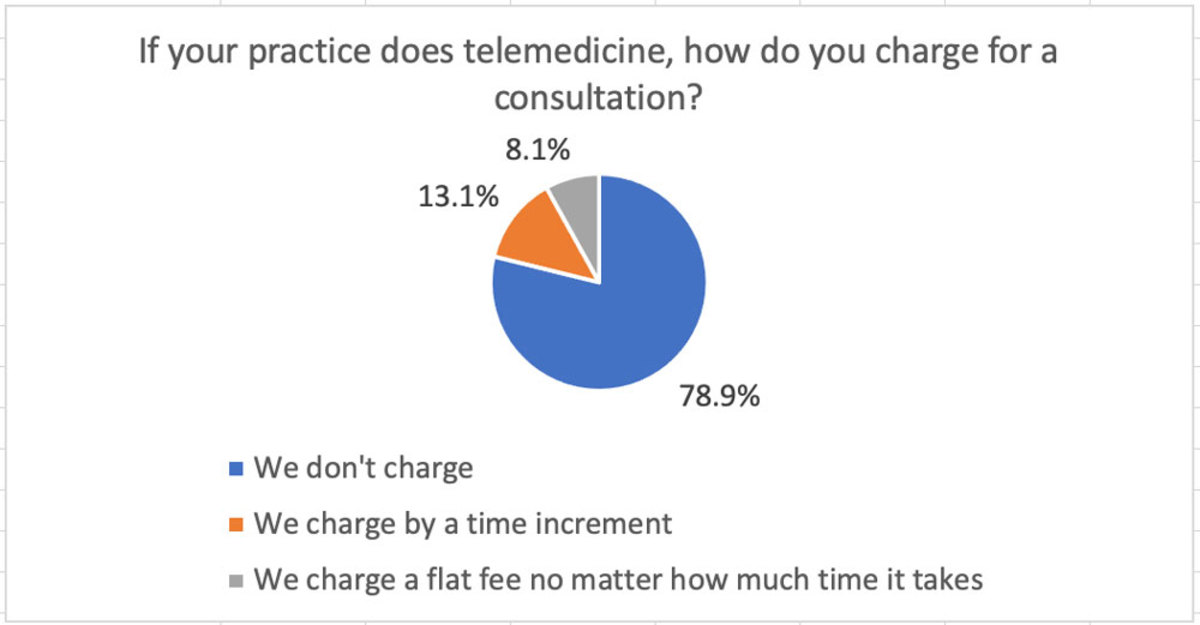
When asked about charges for telemedicine, 78.9% of respondents reported that no fee was charged. 13.1% said they charged per time increment, and 8.1% replied they charged a set price regardless of the amount of time spent (see Figure 16).
Comments included questions such as “I wish we did. We need to figure out how to start to do this.” And “We should! How do you start this when you haven’t in the past?!”
(Editor’s note: Watch for the article in the Spring 2022 EquiManagement magazine on AAEP Convention Medical Coverage that included a Table Topic report on Telemedicine.)
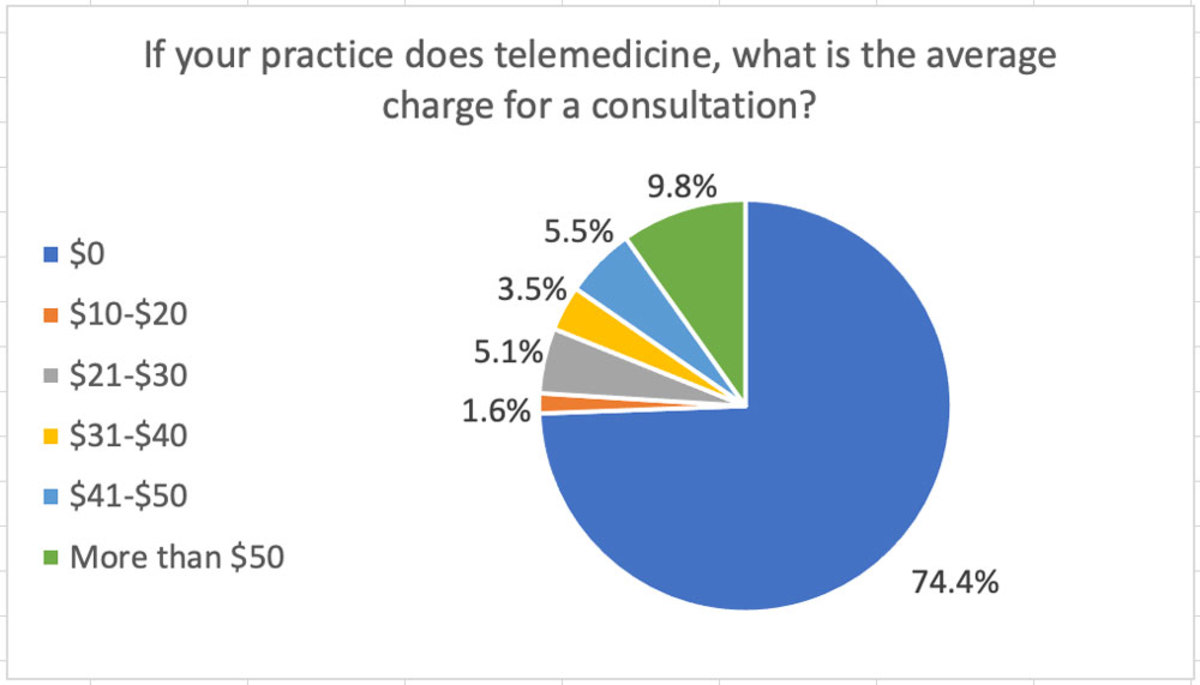
When asked about the actual amount of fees, there was considerable variation (see Figure 17). Although three-quarters of respondents replied they do not charge, almost 10% charge more than $50, the next highest number.
As practices have been increasingly busier, telemedicine should allow clients to have questions answered and rechecks done without an in-person vet visit, increasing efficiency. Veterinarians need to remember that as service providers, they are selling their time. Giving their time without a fee might seem like a way to please clients, but in fact, it will also train them to expect answers for free. Instituting a charge that is based on an hourly fee for professional time can encourage clients to be organized and concise with their communications and help to increase compensation for doctors.
Veterinarian Stress
The next survey questions addressed the stress that equine veterinarians have experienced due to the increased demand for services at a time of a low supply of available veterinarians and staff to hire to help with the load.
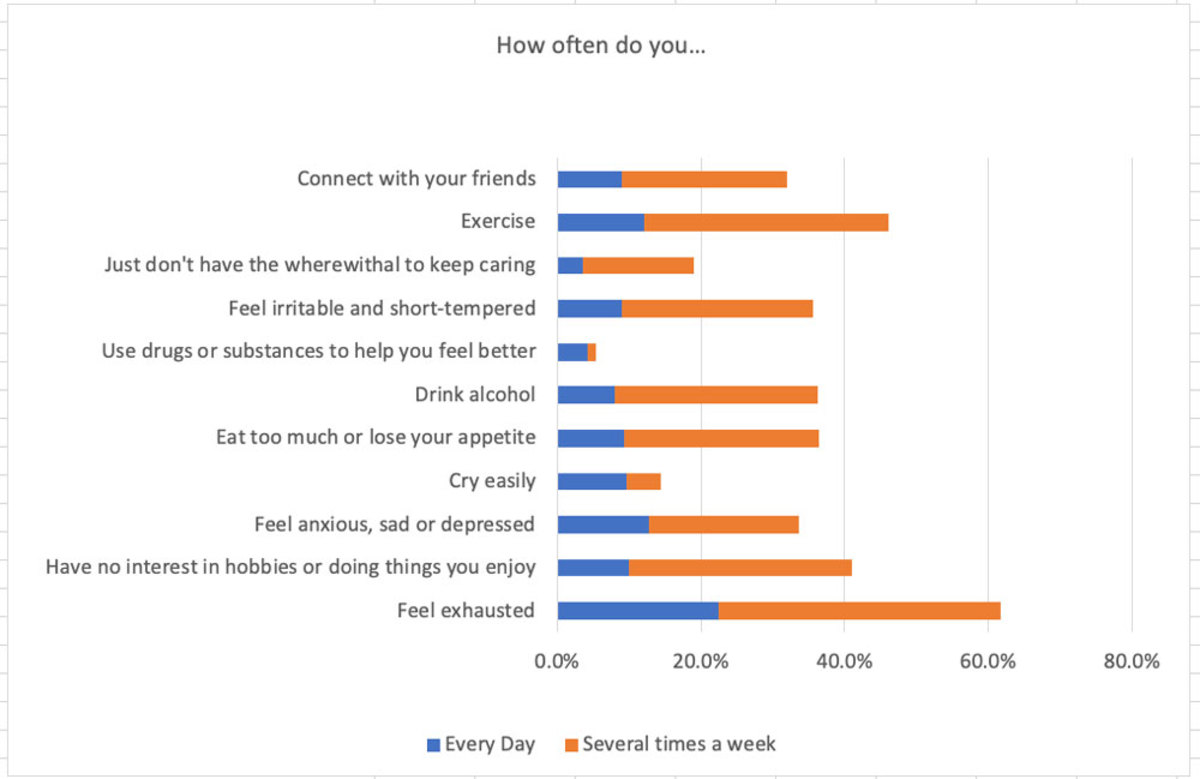
Respondents were asked “How often do you…” with a list of feelings and actions of self care or coping methods (see Figure 18).
More than 60% of respondents indicated they feel exhausted every day (22.5%) to several times a week (39.2%), and just over 40% regularly lose interest in hobbies or doing things they enjoy. About a third replied that they feel irritable and short-tempered, drink alcohol, eat too much or too little, and/or feel anxious, sad or depressed at least several times a week. Fortunately, almost half of respondents exercise and about a third connect with friends regularly each week. Sadly, almost 20% said they lost their capacity to care at least several times each week.
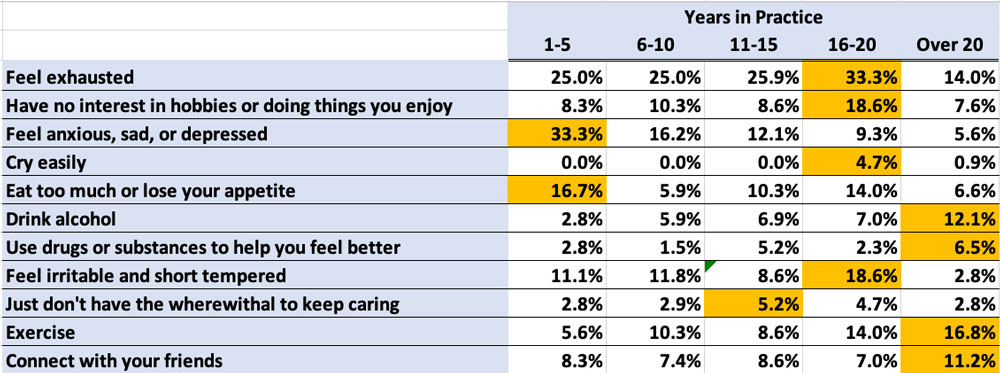
When looking at these statements of experiences in feelings and activities, differences emerged depending on years of experience as an equine practitioner (see Figure 19). While all cohorts except those with more than 20 years of experience had over a quarter of respondents who indicated they were exhausted every day, a full third of those in years 16-20 of practice had this response. This group also had the highest percentage that reported daily loss of interest in hobbies or doing things they enjoyed, crying easily on a daily basis, as well as feeling irritable and short-tempered every day. It is uncertain why these more experienced practitioners showed such a response. Perhaps the difficulty in finding associates to share the load of increased demand for services and emergency coverage, coupled with increased departures of equine veterinarians for other positions outside the equine space, forced these older doctors to work longer hours and cover more emergency shifts in the last several years than they had previously.
A third of those respondents with just 1-5 years of experience reported feeling anxious, sad or depressed on a daily basis, followed by 16.2% of those with 6-10 years in practice. This percentage continued to fall as experience increased. These findings are consistent with several other studies of wellness in the past five years, each of which found that more recent graduates were more vulnerable to mental health concerns. The stresses of educational debt, responsibilities of caring for children and low compensation relative to the effort and number of hours worked could be reasons for this disparity.
When considering how veterinarians ease their stress, those with 1-5 years in practice reported the highest percentage (16.7%) that ate too much or too little. Those with more than 20 years of experience reported the highest numbers of respondents with daily consumption of alcohol (12.1%) or other drugs (6.5%). Losing the capacity to keep caring on a daily basis was not common—all cohorts had less than 5% affected in this way except those with 11-15 years in practice at 5.2%.
Positive daily self-care became more prevalent with more years in practice. Those with more than 20 years of experience were more likely to report daily exercise (16.8%) and connection with friends (11.2%). These results might be related to younger veterinarians having young children that command their time and energy outside of work and having less control of their work schedules.
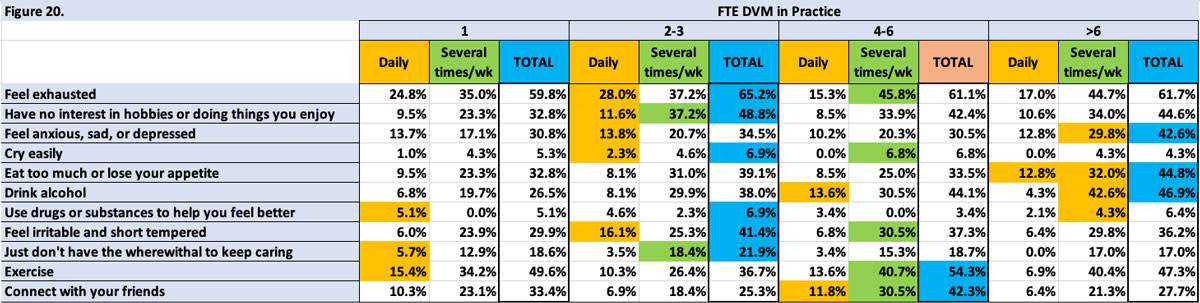
The size of practice had an effect on how respondents reported the experiences or actions (see Figure 20). Although all practice size respondents had high additive reports of exhaustion, 28% of those in 2-3 FTE DVM practices were exhausted on a daily basis and 37.2% several times a week—a total of 65.2%. This small practice size also had the highest additive numbers of veterinarians reporting having no interest in hobbies, crying easily, using drugs, feeling irritable and losing the ability to care.
Practices with 4-6 FTE DVMs had the highest additive numbers for those who exercised and connected with friends. The largest practices (>6 FTE DVMs) had the highest additive scores for feeling anxious, sad or depressed, changes in appetite and drinking alcohol.
When asked “What has your practice done to support the health and well-being of team-members during the last two years?”, respondents had many different responses:
- “Little to nothing. Our workload has increased due to veterinarians leaving, so the work has increased for everyone including the owners. Associates have begun to bring concerns to the owners, and it appears as though they are trying to help, but no outright efforts were made solely on their own.”
- “Shortened work week for various employees, supported/encouraged counseling, extra days off for stress compassion, non-judgmental COVID education/discussions, encouraging compliments and helping attitudes.”
- “Celebrate milestones, four-day work week, increased wages.”
- “Kept track of hours worked and stopped taking clients once the hours got too many.”
- “Raises, team building and appreciation activities.”
- “Sponsored clinic get-togethers with food, drinks and activities plus generous bonuses.”
Unfortunately, about a third of the responses indicated that nothing much had been done to acknowledge the sacrifices or reward the hard work of practice teams during this time of significant growth in practice demand. Said one, “Generally, nothing has been done to support us. When someone reaches the crying stage, they sometimes buy us lunch.”
But a heartwarming response that prioritized the team and the collaboration with colleagues stated, “We do not tolerate clients that treat any team member poorly or are inappropriately demanding. We have had get-togethers with one another and our families and support one another when associates are away. There are five practices with eight vets that share on call and daily coverage around our territory to help one another with daily emergencies. Each practice bills for their time and the regular practice takes over the next day the regular veterinarian is available.”
When all the members of a practice, including the owner(s) are working so much harder, with a backdrop of increased personal and family stressors, it can be hard for practice owners to find the energy and time to support their teams, but it is essential!
The Great Resignation that has gripped the country’s labor pool can reach into veterinary medicine, too. Showing understanding for employees and their needs is essential in retaining talent. Collaboration with colleagues can provide connection and belonging at a time when it has never been more important.
Take-Home Message
As equine veterinarians and their staff continue to put in more effort to meet the needs of their clients and patients, it is good to know that almost all are doing well financially despite their increased stress. But finding new, more efficient ways to deliver care will be important in easing the burden of the heavy workload. Utilization of technicians, assistants, and office staff for tasks that do not require a veterinarian’s attention could ease the strain and be economically sensible as well. Developing new paradigms in equine practice—changes that welcome new graduates to a life that is sustainable—will also make an important difference in the profession. The uncertainty of how the future will unfold cannot be controlled, but offering empathy and kindness to all can make the journey more peaceful and fulfilling.
This content is subject to change without notice and offered for informational use only. You are urged to consult with your individual business, financial, legal, tax and/or other advisors with respect to any information presented. Synchrony and any of its affiliates, including CareCredit (collectively, “Synchrony”), make no representations or warranties regarding this content and accept no liability for any loss or harm arising from the use of the information provided. All statements and opinions in this article are the sole opinions of the author and roundtable participants. Your receipt of this material constitutes your acceptance of these terms and conditions.
![[Aggregator] Downloaded image for imported item #19998](https://s3.amazonaws.com/wp-s3-equimanagement.com/wp-content/uploads/2026/05/29122748/EDCC-Unbranded-5-scaled-1-768x512.jpeg)